
Boost Your Coding Efficiency: 7 tips for Visual Studio Code


Visual Studio Code (VS Code), developed by Microsoft, is now regarded as one of the best code editors. With its flexibility, a wide array of features, and strong community backing. Developers love it because it is not resource-hungry and boasts an impressive active community, and this article provides you with seven essential tips to work better.

Discover how at OpenReplay.com.
An efficient coding environment creates a productive, error-minimizing, collaborative, educational, consistent, resource-managing, and ultimately satisfying programming environment. For this reason, it is wise to create such environments using VS Code, for instance. Developers who spend time tailoring VS Code to the best of their ability will always produce outstanding software.
Seven practical suggestions for the top programming efficiency with VS Code in 2024 are provided in this article. They include:
- Customizing the Interface
- Extensions to Enhance Productivity
- Mastering Shortcuts and Keybindings
- Utilizing Snippets for Code Efficiency
- Integrating Version Control
- Leveraging IntelliSense and Code Navigation
- Efficient Debugging Techniques
Customizing the Interface
VS Code’s workspace offers the utmost flexibility in terms of personal adjustments. If its layout options are used well, one will have a coding environment that maximizes productivity while minimizing visual distractions.
Using VS Code, you can work on many documents simultaneously by dividing your editor into various sectors. To divide your editor, follow these steps.
To split the editor, click the “Split Editor button” in the upper right corner of the editor tab. This icon is a square divided in half vertically, i.e., two rectangles placed side by side. Your existing editor will then be divided into two vertical parts.
Using the keyboard shortcut, press Ctrl + (Cmd + for macOS). To move the editor to another location, press Ctrl + K and then one of the arrow keys (left, right, up, down).
To navigate between sectors, click the sector you are interested in or focus on the areas with Ctrl + 1, Ctrl + 2, etc., to jump from one to another (in accordance with the order of split panes from left to right). You can repeat the split process in any of the existing sectors to create more sectors.
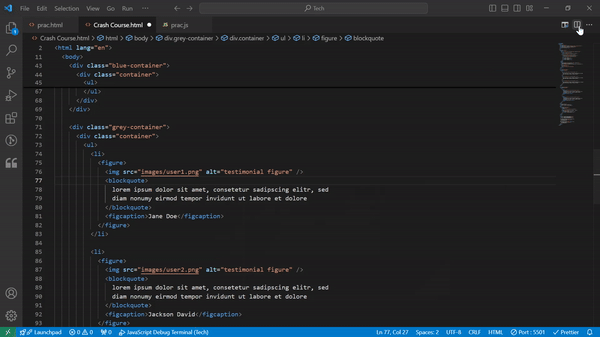
It is very beneficial in situations like these when codes are being compared, debugged, or checked for alterations.
You can immerse yourself in your code by getting rid of distractions through Zen mode. It is a full-screen mode that hides the activity bar, sidebar, and panel so that one can only concentrate on their coding. You can activate this feature on Windows by pressing Ctrl+K+Z on your keyboard or Cmd+K+Z on MacOS and exit by pressing Esc twice. Toggle Zen mode by clicking ‘View’ > ‘Appearance’ > ‘Zen Mode Menu’.
Themes and Icons
Theme and Icon Packs for Coding VS Code has a large library of themes and files that you can use to customize your workspace.
Choose a color scheme that is visually friendly and increases code readability. Long coding hours can strain your eyes; try dark background themes. Press Ctrl + K Ctrl + T to activate this feature for Windows and Cmd + K Cmd + T on macOS.
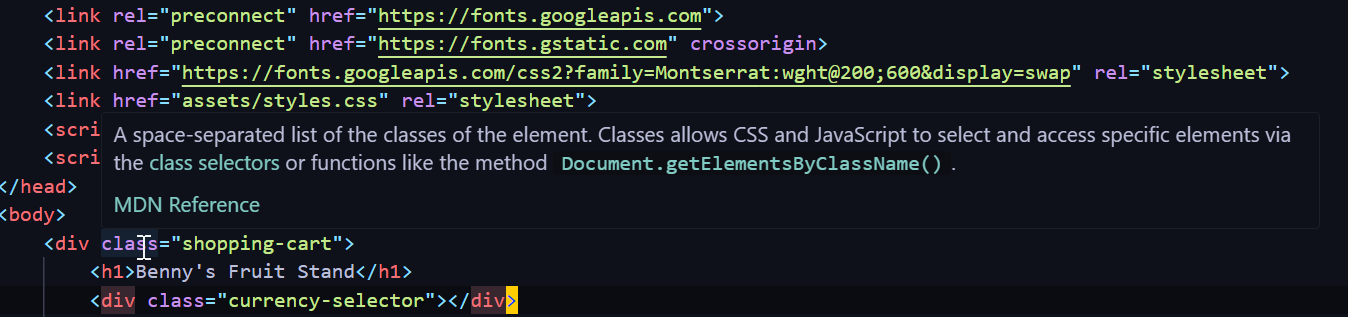
Is the visual part of this obsidian note-taking process boring your file organization? Most icon packs provide unique icons for every type, and choosing them can be very useful for identifying a file right out of your docks.
If you play with better layout options, themes, and icons, you can effectively use this help tool as a cool environment for your everyday coding experience.
Extensions to Enhance Productivity
Extensions play a vital role in changing the VS Code to make it a competitive and tailored place for people to develop. Just by picking and managing (or removing) extensions’ chaotic flow, you can gain a huge productivity advantage.
Whatever your dev needs, there are VS Code extensions for just about everything. Some main categories of add-ons you may require include:
Prettier
Prettier is a rigid code formatter that makes sure that it maintains uniform styles over your code base. For example, it ensures that there is no difference in tabs and spaces used for indentation, it unifies the usages of single or double quotes, wraps long lines automatically to avoid reading challenges, and can insert or remove semicolons optionally.
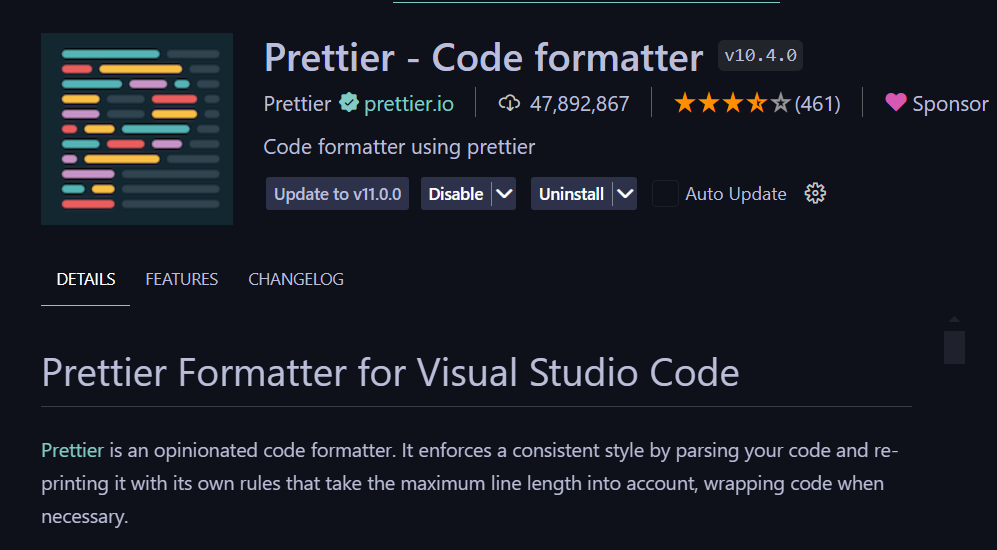
Prettier takes care of the formatting, so you can spend more time writing code and less time maintaining clean syntax.
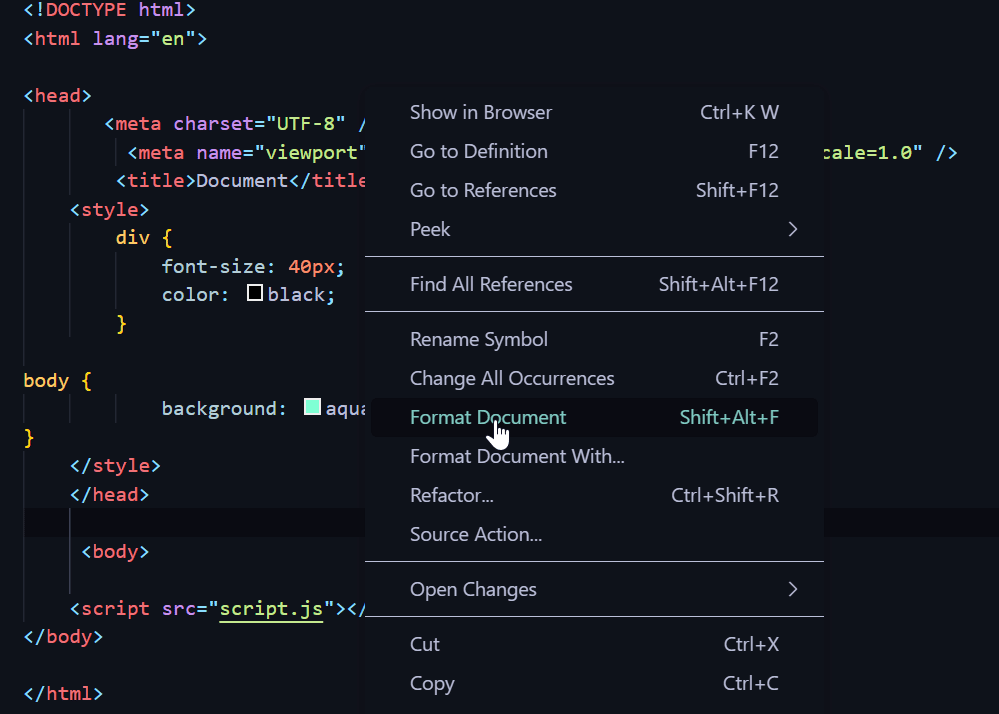
To use Prettier for document formatting in Visual Studio Code (VS Code), open your VS Code settings (Ctrl + ,). Search for “default formatter” and set “Prettier - Code Formatter” as the default. For manual formatting, right-click inside the editor, select “Format Document”, or use the shortcut Shift + Alt + F.
ESLint
ESlint - A linter for JavaScript Code. It checks your code for syntax errors, possible bugs, and troublesome patterns are identified, draft code is compared with guidelines for consistency, and you can set your own rules or those of the community-shared presets to automatically correct some violations in the style of code.
For example, if you mess up your indentation or try to call a missing function out of nowhere instead of using let and not var, ESLint will warn you about this behavior by understanding that something is wrong while you are developing.
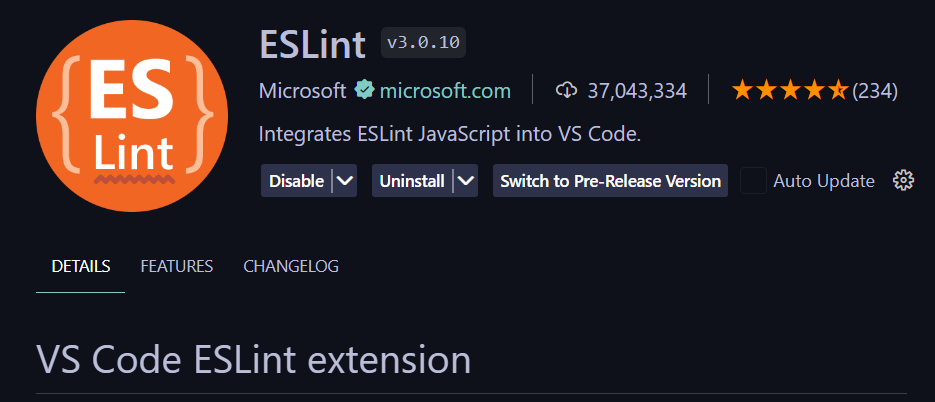
In the development process, ESLint can catch early issues that can result in better and more reliable code. The code written with ESLint is usually free of errors and easier to understand. It is necessary to learn how to use this tool in the best way possible.
Live Server
Live Server is a simple development tool for those of you who want to see the changes made in your content directly on the browser. This means that if you make changes to your code and save it, the browser will automatically refresh itself using those updates. Changes are reflected immediately without manually refreshing the browser during the website development process to avoid manual refresh.
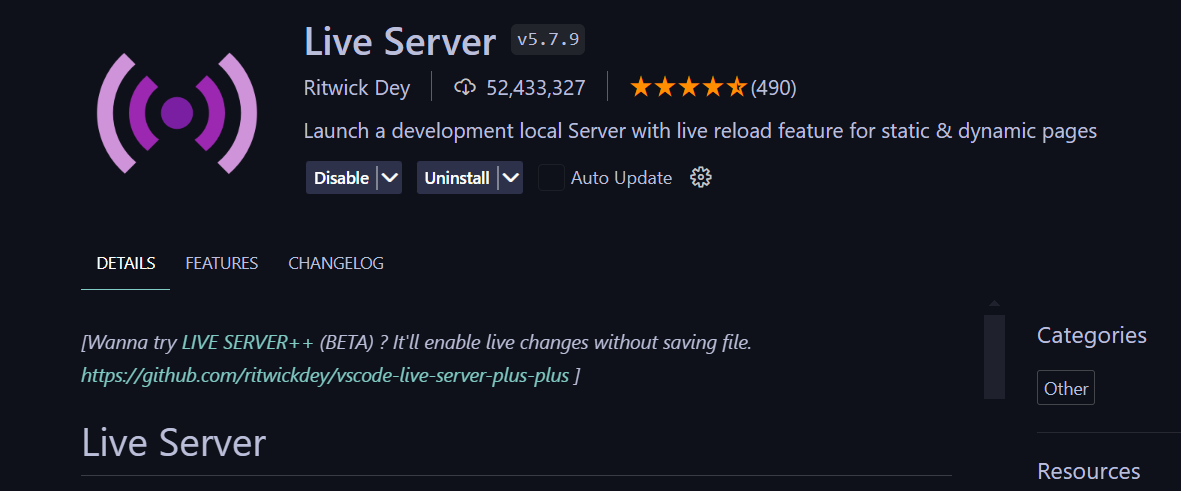
Live Server makes your development effort quite delightful by providing a live preview of your project.
To preview an HTML file via the Live Server of Visual Studio Code, first go to the folder where your HTML files are stored by selecting “File” > “Open Folder” from the top menu bar. Alternatively, click on the “Go Live” button, which is usually found at the bottom right corner of the status bar.
Your web browser will then launch showing you your HTML file. Any modification you make in the HTML (or related CSS and JS) will instantly be reflected in the browser.
Prettier, ESLint & Live Server can be combined to develop efficiently with code quality and consistency at high speed.
Managing Extensions
It is crucial to deal well with your extensions to maintain a fast development environment. To keep your collection light: Only install the extensions you need. Temporarily disable unnecessary, unused ones to enhance performance. Update the current extension you have used to enjoy new features and patches accompanying potential security improvements. When you are facing issues, disable conflicting extensions to find the root cause.
If you choose the right VS Code extensions and use them wisely, you can create a personalized and efficient development space that works best for you.
Mastering Shortcuts and Keybindings
Quick ways of typing are the secret tools of effective programmers. Once you understand these types of things and use them in your programming, you may find yourself doing things much faster than before without moving around with the mouse so often. With this in mind, here are some key VS Code keyboard combinations that should be your first set of commands:
Ctrl+P: Open the command palette.Ctrl+Tab: Switch between open editors.Ctrl+Shift+N: Open a new file.Ctrl+W: Close the active editor.Ctrl+F: Find text in the current document.Ctrl+H: Replace text in the current document.Ctrl+X: Cut selected text.Ctrl+C: Copy selected text.Ctrl+V: Paste copied text.Ctrl+Z: Undo.Ctrl+Y: Redo.
Keep in mind that only a few examples are listed here. VS Code contains numerous shortcuts that can be modified according to your taste. Here’s a link to a resource with more shortcuts.
Custom Keybindings
VS Code lets you create special keystrokes for actions that you use regularly. This implies that task processing can be primed in a good way. If you wish to create a personalized keybinding, open the Command Palette Ctrl + Shift + P. Then, type the words. Don’t forget to select the option ‘Open Keyboard Shortcuts’ and look for a command that you would like to change. After that, just click on the desired keys.
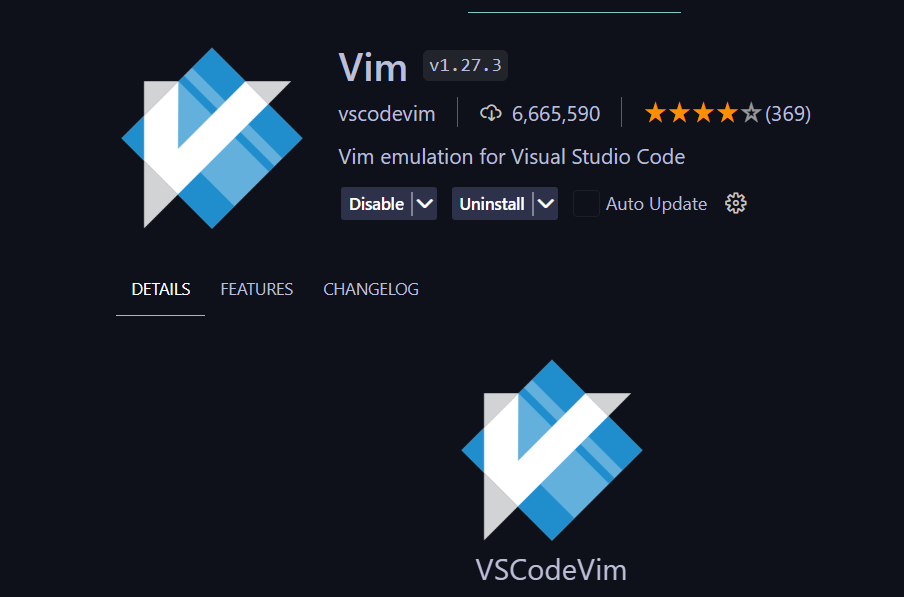
You can improve your keybinding environment by employing add-ons such as VSCodeVim, which delivers Vim keyboard shortcuts for the VS Code platform.
When you use keyboard shortcuts and personalize your key bindings, coding becomes faster and more efficient than before.
Utilizing Snippets for Code Efficiency
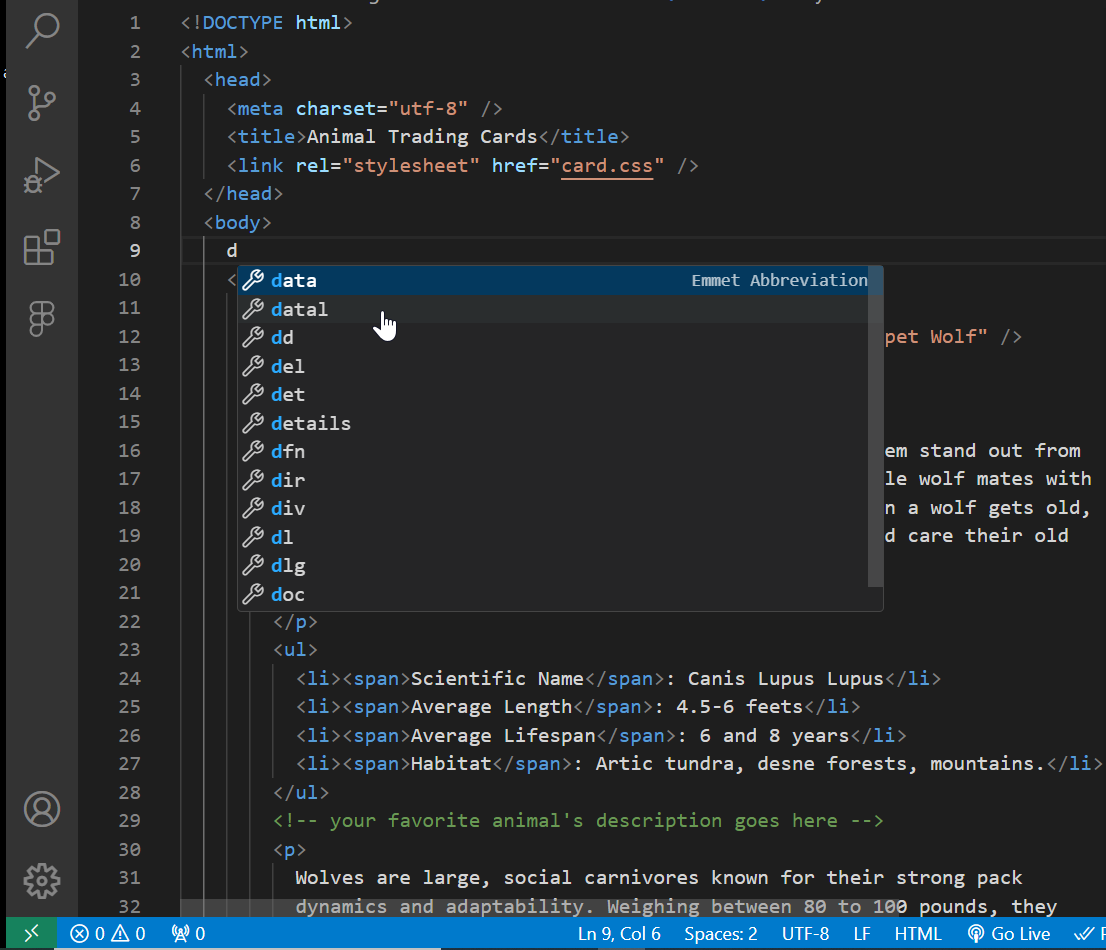
Pre-written code templates can greatly hasten your coding process. Snippets could also assist in other repetitive tasks and allow you to pay attention only to the main logic in your code. Pre-installed Snippets VS Code has supported snippets that are programmed into it for several programming languages. These snippets have standard code frameworks; this way, they save a lot of time and energy on your part.
To access built-in snippets, type the keyword that pertains to the snippet you want. Based on your input, VS Code will provide suggestions for available options. Select the desired snippet and press Enter or Tab to add it to your code. As an illustration, typing ! and hitting Tab in HTML produces a basic structure for HTML.
Creating Custom Snippets
To create personal snippets for code patterns you often use, you should access snippet settings. Go to ‘File’ > Preferences’ > ‘User Snippets’ or press Ctrl + Shift + P and type ‘Preferences: Configure User Snippets’. Select your preferred language or create a new snippet file by clicking on ‘New Global Snippets file’ for all languages.
Add a new snippet definition in the JSON file. Here’s an example of an HTML snippet:
{
  "Print to console": {
    "prefix": "myform",
    "body": [
      "<form action='text'>",
      "<div>",
      "<input type='text' placeholder='Enter Name' />",
      "</div>",
      "<div>",
      "<input type='text' placeholder='Enter Age' />",
      "</div>",
      "<div>",
      "<input type='text' placeholder='Enter Email' />",
      "</div>",
      "<div>",
      "<input type='text' placeholder='Enter Name' />",
      "</div>",
      "<button class='eta'>Submit</button>",
      "</form>"
 ],
    "description": "creates a google form"
 }
}prefix: The trigger word for the snippet.body: The lines of code to be inserted. Use$1,$2, etc., for placeholders.description: A brief description of what the snippet does.
Save the snippets file. Your custom snippets will be available in IntelliSense, just like the built-in snippets.
You can share your snippets file with your teammates, by copying the JSON file to a shared location or repository. Teammates can import shared snippets by putting the JSON file into their own snippets directory, usually located in the VS Code user settings directory. For instance, free editable snippets such as Snippet Store is another alternative that makes sharing and controlling these pieces of information easier.
Integrating Version Control
Managing code modifications, working together with others, and going back to previous conditions can’t be done without version control. VS Code supports Git so that your projects will be effectively managed without any problems.
To use Git in VS Code, please check that you have Git already installed on your device. After that, run the downloaded installer and follow the installation prompts. For most users, the default settings are sufficient. Open a terminal or command prompt. Type git --version and press Enter. You should see the installed Git version, confirming that Git is installed correctly.
Launch VS Code, and open the integrated terminal by going to ‘View’ > ‘Terminal’. In the terminal, enter the following commands to set your Git user name and email:
git config --global user.name "Your Name"
git config --global user.email "your.email@example.com"
Hit the Source Control icon in the Activity Bar or press Ctrl + Shift + G to enter the Source Control view. If you have opened a project folder in VS Code, the “Source Control view” also contains an option to initialize a repository, which can be used to create a new Git repository inside the active project folder.
To clone an already set repo, by hitting on “View”, then on “Command Palette” (or pressing Ctrl + Shift + P), you will be able to get one. Git: Clone should be the phrase you type, followed by its selection from the displayed possibilities. You will need to input the URL of the repository and specify which directory you want it saved in. Associate your offsite repositories now saved within sites like GitHub,GitLab, or Bitbucket with this local repository of yours.
Following these steps, you should have Git installed and configured in Visual Studio Code, ready to manage your source code and version control workflows.
Useful Git Extensions
While VS Code’s built-in Git integration is robust, additional extensions can enhance your version control experience:
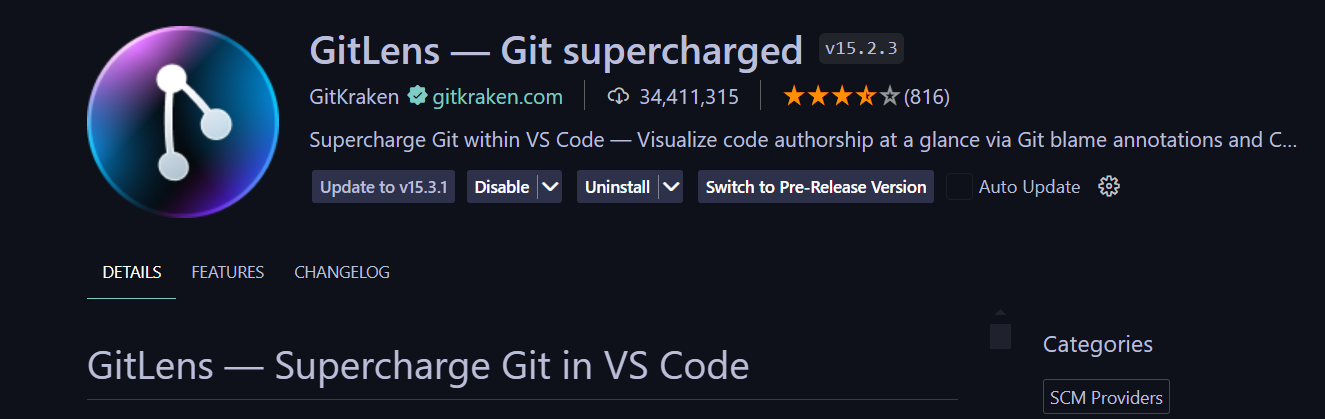
GitLens: GitLens supercharges the Git capabilities in VS Code, providing features like information on code authorship, comparison of commits, annotations of blame, and file history.
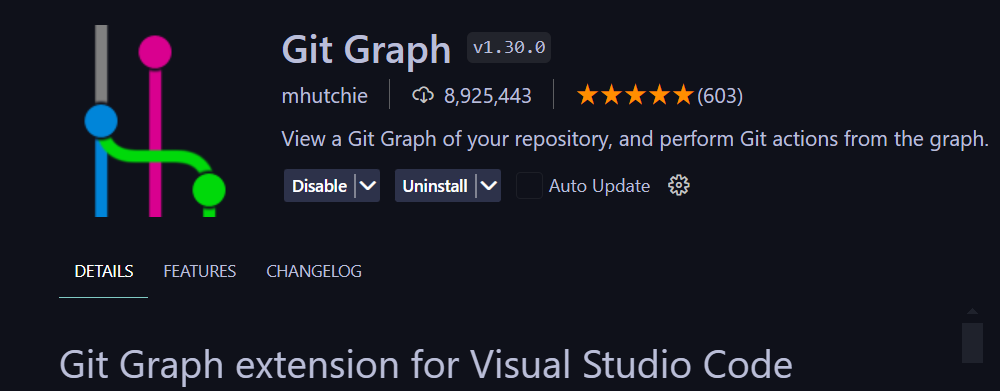
Git Graph: Git Graph provides a graphical view of your Git history, which allows one to easily comprehend intricate splitting and combination happenings. The proper functioning of Git, together with these add-ins, will ensure the swift flow of all processes involved in software development, teamwork capabilities, and library safety.
Leveraging IntelliSense and Code Navigation
VS Code is one of the modern IDEs and code editors that have integrated the intelliSense tool for effective code completion. It offers a variety of functions that enhance user experience when dealing with codes, increase productivity levels, and minimize errors.
While you type, IntelliSense will give you some suggestions anywhere in your code about names for variables, functions, types of classes, libraries of modules, etc. IntelliSense makes the list shorter, depending on the current scope you are working within - method, class, or module.
IntelliSense displays information regarding parameters of different types, in that format. It appears right after you begin writing a function name and open its parentheses.
When the cursor is placed over a symbol (variable, function, class, or any other similar entity), an elaborate tooltip with different details like documentation comments, type information, and its definition location appears.
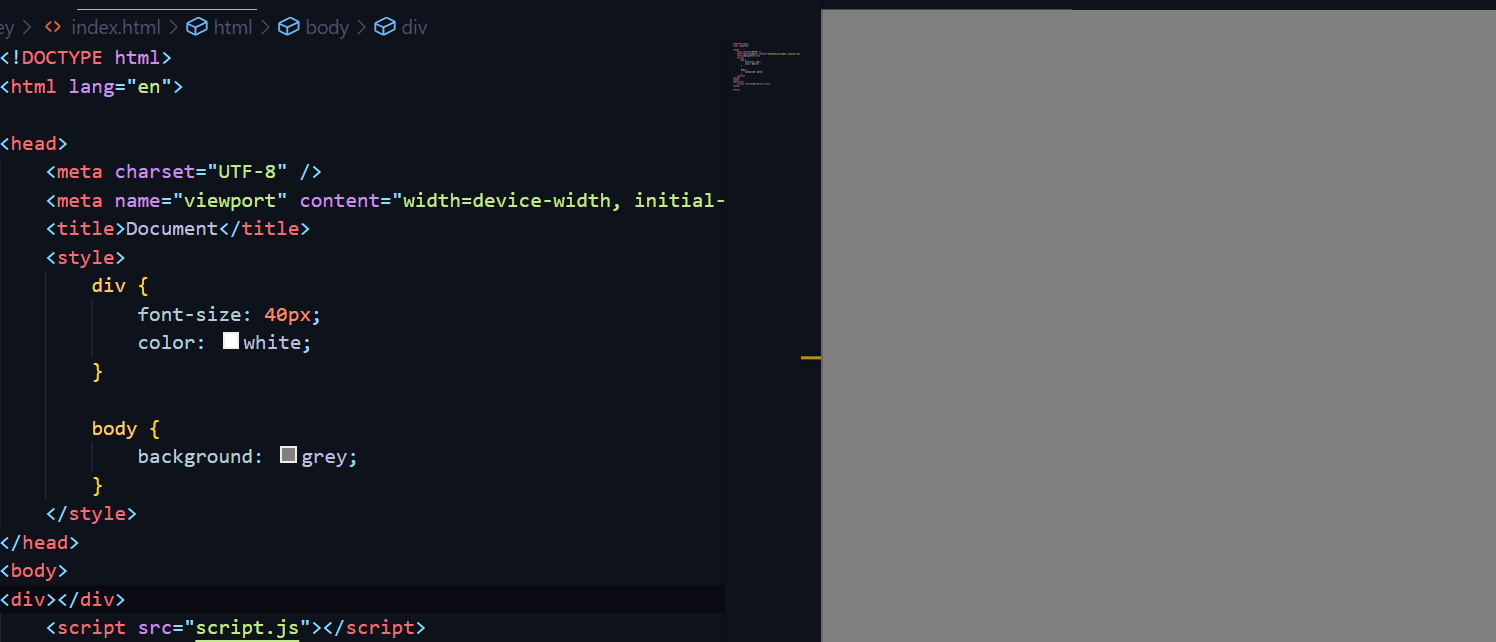
While coding in IntelliSense, syntax errors, type mismatches, and other issues are highlighted in real time, allowing mistakes to be corrected during the programming process.
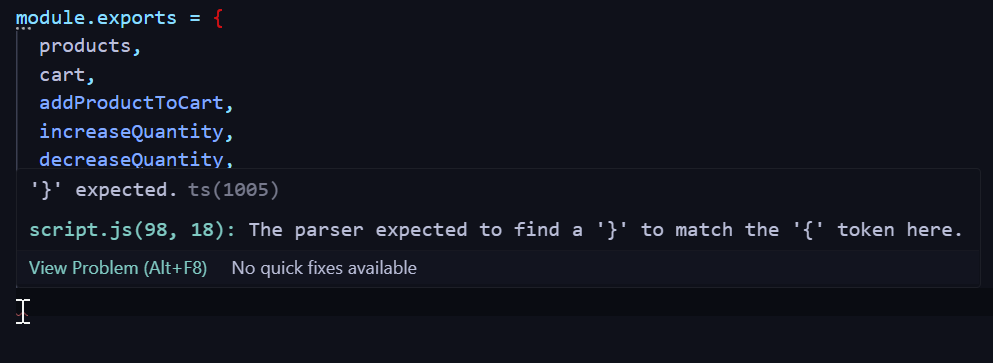
From the image, it can be seen that the error message specifies a syntax error detected in your JavaScript code. The parser did not find its expected closing curly brace }, which suggests either a missing or excess curly brace elsewhere.
Efficient Code Navigation
Efficient code navigation is crucial for maintaining and understanding large codebases. Here are some key techniques and tools for navigating code efficiently in VS Code:
- Go to Definition: Right-click on a symbol (variable, function, class, etc.) and select ‘Go to Definition’ to navigate directly to where it is defined. You will be able to grasp the specifics of the implementation promptly.
- Find All References: Right-click on a symbol and select ‘Find All References’ to see all the places in your code where the symbol is used. Understanding the impact of changes and restructuring is very useful in some instances.
- Symbol Search: Use the shortcut
Ctrl+P(orCmd+Pon macOS) and type@followed by the symbol name to quickly search for and navigate to functions, classes, or variables within the current file. UseCtrl+Shift+F(orCmd+Shift+Fon macOS) to search for symbols across the entire workspace. This is useful for finding occurrences of a symbol across multiple files. - Outline View: The Outline view provides a tree view of the symbols in the current file, allowing you to quickly navigate to different parts of the file. It helps when you are dealing with massive texts containing multiple functionalities/classes.
- Peek Definition: Use ‘Peek Definition’ (
Alt+F12orOption+F12on macOS) to view a small window with the definition of a symbol without leaving the current context. This allows you to read and understand the definition without losing your place in the code.
With IntelliSense and tools to help you navigate your code more quickly, it boosts your productivity as well standard of coding. Code completion, parameters info shown on cursor hover quick information is what intellisense does to help you make way with less goof-up.
Efficient code navigation techniques, such as go to definition, find all references, symbol search, and outline view, help you quickly understand and maintain large codebases.
Efficient Debugging Techniques
The development process includes very crucial debugging. It is easy to see that there are some strong advantages of using VS Code as a debugging tool. VS Code has an integrated debugger compatible with different programming languages.
Setting Breakpoints
In many Integrated Development Environments (IDEs), including VS Code, PyCharm, and Eclipse, you can place a breakpoint by clicking on the margin beside the line number where you want to stop the execution to check for variables and program state. Alternatively, you can place the cursor on the line and press F9 to toggle a breakpoint.
Starting the Debugger
To open the Run and Debug views, click on the Debug icon that appears on the Activity bar or press Ctrl + Shift + D. To start debugging, click on the Run button or press F5. If you have already set the configuration, it will start accordingly; however, if not, you might need to create a launch configuration.
At a breakpoint, the execution is put on hold; therefore, when you place your cursor over variables, you will see their current values.
The VARIABLES section in the Debug panel shows the values and types of all variables in the current scope.
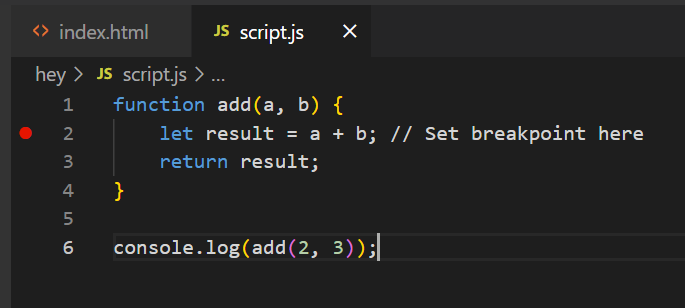
For example:
function add(a, b) {
  let result = a + b; // Set breakpoint here
  return result;
}

console.log(add(2, 3));- Set a breakpoint on the line
let result = a + b;. - When the debugger is initiated, execution will stop at the designated breakpoint.
- This enables you to check the values of
aandbbefore returning theresultvariable. - When paused at the breakpoint, you can hover over
a,b, andresultto see their current values. - The values for
a,b, andresultcan be found in the VARIABLES portion of the Debug panel.
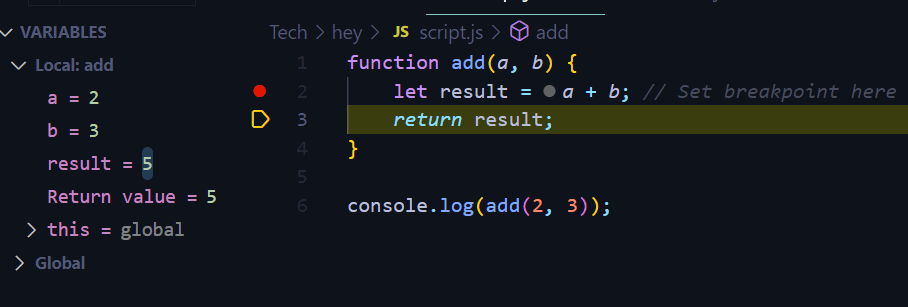
This way, you can make sure the function is operating accurately.
Using the Call Stack
The call stack reveals the chain of function calls that brought you to the particular point of execution. It allows you to follow the path executed and see how exactly you ended up in this particular position. Through various frames (functions) within the call stack window, one can move about to check how things are at every level. This will prove quite beneficial when troubleshooting recursive functions or deeply nested calls.
For example:
function greet() {
  console.log("Hello, world!");
  sayGoodbye();
}

function sayGoodbye() {
  console.log("Goodbye, world!");
  saySomethingElse();
}

function saySomethingElse() {
  console.log("Something else!");
}

greet();
As the debugger reaches a breakpoint or when you move stepwise through the code, the sequence of function calls is exhibited in the Call Stack panel.
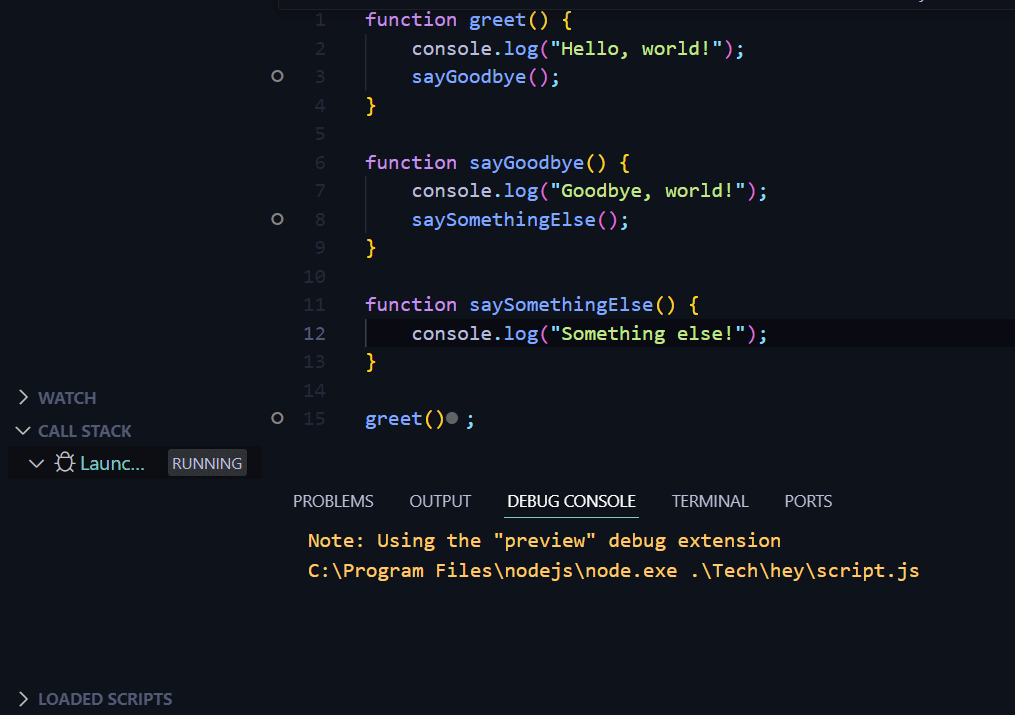
The initiated program starts from an empty call stack. The call stack receives the greet() function and its variable context when it is invoked. Therefore, greet is the only frame in this call stack at this point.
At first console.log("Hello, world!") is executed, later then sayGoodbye() comes next. The sayGoodbye () function’s context goes onto the top of one’s pile of calls. Now two frames can be found on the call stack: greet and sayGoodbye.
So, when console.log("Goodbye, world!") is executed, that would mean it is calling upon saySomethingElse. The execution context of the function saySomethingElse() is then pushed onto the top of the call stack. The call stack at this moment holds three frames; greet, sayGoodbye, and saySomethingElse.
console.log("Something else!") executes. Since there are no other functions invoked, saySomethingElse() comes back which results in calling context being removed from stack. Currently, two frames remain in call stack: greet and also sayGoodbye.
The moment saySomethingElse() ends executing, sayGoodbye() also comes to an end and returns, removing its context from the stack. Currently, only one element exists in the call stack: greet.
In the end, greet() completes and returns, once more leaving the call stack empty.
Using the Watch Window
The watch window allows you to track particular variables or expressions. While you are debugging your code, you may add any variables to this window and their values will change accordingly.
For example:
function add(a, b) {
  let result = a + b; //Set breakpoint here
  return result;
}

console.log(add(2, 3));- Add
a,b, andresultto the Watch window. - When you run the debugger and execution stops (for example, at a breakpoint or during a step-through), the Watch window displays the present values of
a,b, andresultin this case. - This helps show that
resultis correctly calculated as the sum ofaandb.

Here you can observe dynamic variations in variables that take part in execution flow or assess the results of complicated expressions.
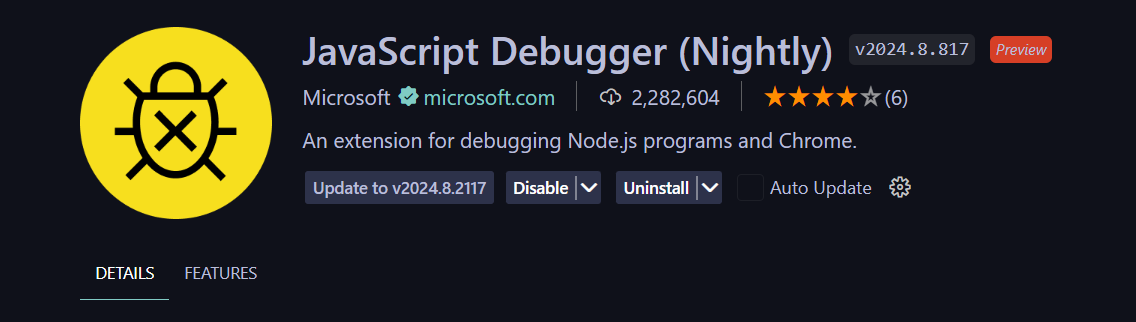
Debugging Extensions
Using debugger add-ons can improve the use of debugging features in your development environment. These days, the most popular debug add-on is JavaScript Debugger, which is mostly preferred by web developers.
With this extension in place to augment your coding capabilities, debugging JavaScript can be twice as good, and it will be less difficult when debugging client-side and server-based codes.
VS Code’s debugging tools and the JavaScript Debugger make a great combination. You can debug JavaScript using Node.js or a browser (for example, Chrome).
Configuration for Node.js:
Open the Command Palette by clicking Ctrl + Shift + P. Type “Debug: Open Configurations” and select it. If no launch.json file exists, VS Code will prompt you to create one. Choose “Node.js” as the environment. Include the following setup in your launch.json file which is located in the VS code directory:
{
  "version": "0.2.0",
  "configurations": [
 {
      "type": "node",
      "request": "launch",
      "name": "Launch Program",
      "program": "${workspaceFolder}/app.js"
 }
 ]
}type: Specifies that this is a Node.js configuration.request: launch indicates that you are launching the Node.js application.program: Points to the main script file of your Node.js application.- Run the Debug panel (Ctrl + Shift + D).
- The dropdown menu should be used to select your configuration and then you press the green play button or the
F5key to begin debugging.
Use the following shortcuts to step through your code while debugging:
F10: Step over to the next line of code.F11: Step into a function call.Shift+F11: Step out of the current function.
By executing these efficient debugging methods, you will cut down the time spent on projects and improve the efficiency of identifying and fixing errors in your programming assignment. Being adept at using both standard debugger options or harnessing powerful add-ons such as JavaScript Debugger will make you an efficient and prolific programmer.
Conclusion
If you want your computer programming experience to be better and more productive, use Visual Studio Code effectively alongside the tips outlined in this article. Strategies such as interface customization, shortcut mastery, extension usage, and version control integration are beneficial for optimizing your development process.
Rely on your aspirations and project specifications while experimenting with different configurations to maximize VS Code’s efficiency. Regularly check for fresh extensions, shortcuts, and personalization features for improving your development setting.
You will enhance your productivity and have more respect for its features by organizing your VS Code environment.
Understand every bug
Uncover frustrations, understand bugs and fix slowdowns like never before with OpenReplay — the open-source session replay tool for developers. Self-host it in minutes, and have complete control over your customer data. Check our GitHub repo and join the thousands of developers in our community.
