Five best practices for debugging React Native code
Debugging is essential to software development, and React Native is no exception. As a cross-platform framework, React Native offers unique challenges for debugging, especially when it comes to platform-specific issues. This article will share the author’s experience debugging React Native apps and provide five best practices that every React Native developer should know.
1) Using the React Native Debugger
The first step in debugging a React Native app is to use the React Native Debugger. The React Native Debugger is a standalone app with a rich interface for debugging React Native apps. It integrates with the Chrome Developer Tools, allowing developers to set breakpoints, inspect variables, and step through code. To start the React Native Debugger, run the following command in your terminal.
react-native run-android --port=8081Or, if you are developing for iOS
react-native run-ios --debugThis will start the React Native Debugger, and you can connect to it using the Chrome browser by navigating to localhost:8081/debugger-ui.
2) Remote Debugging
React Native remote debugging allows you to debug your React Native application remotely from your computer using a web browser. This can be useful when you want to debug your application running on a mobile device or emulator, as it provides a way to view and interact with the console, inspect the elements on the screen, and execute commands in the application’s context.
To enable remote debugging, you need to follow these steps.
- Enable remote debugging in your React Native application by adding the following line of code to your index.js file.
import { enableScreens } from 'react-native-screens';

enableScreens();- Start your React Native application with the
--remote-debuggingflag like this.
For Android
react-native run-android --remote-debuggingFor iOS
react-native run-ios --remote-debugging-
Connect your mobile device or emulator to your computer using a USB cable.
-
Open the web browser on your computer and navigate to
http://localhost:8081/debugger-ui. -
Click the “Debug Remote JS” button to connect to your application.
-
You should now be able to view and interact with the console, inspect the elements on the screen, and execute commands in the application’s context from your computer.
Note that remote debugging may be slower than local debugging, so using it only when necessary is recommended. Additionally, disable remote debugging before releasing your application to production.
3) Platform-Specific Debugging Techniques
React Native apps can run on iOS and Android, and each platform has its own debugging techniques that developers can use to identify and solve issues.
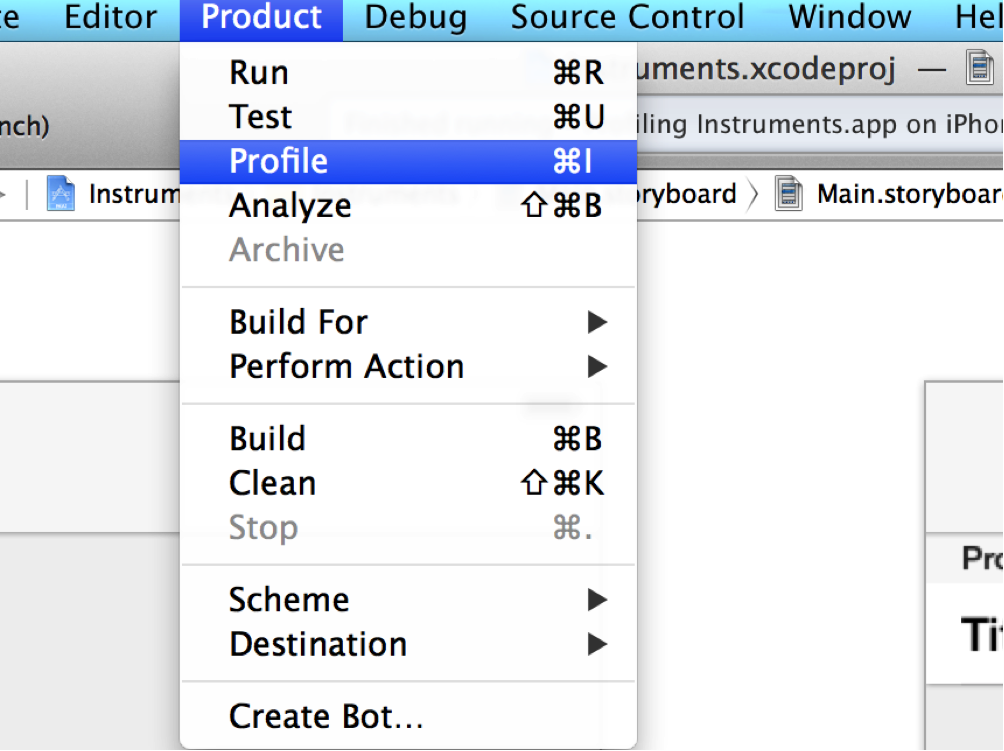
For iOS, Xcode’s Instruments is a powerful suite of tools that allows you to monitor and profile your app in real time. With Instruments, you can track memory usage, monitor network requests, and identify performance bottlenecks in your app. To use Instruments, simply run your app in Xcode and select the “Profile” option from the “Product” menu, as displayed in the image below.
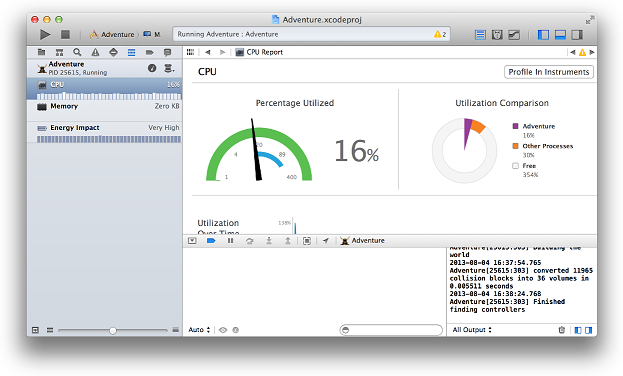
 You are expected to see the “Profile” menu, as displayed in the image below, from which you can debug your application.
For Android, the Android Debug Bridge (ADB) is a powerful tool that developers can use to debug their apps directly on their devices. ADB provides several commands for inspecting your app’s state and managing its processes. For example, adb logcat allows you to view log output from your app in real time and identify any errors or warnings that may occur.
You can also use ADB to capture screenshots and videos of your app running on a device, which can be useful for documenting and sharing bugs with your team.
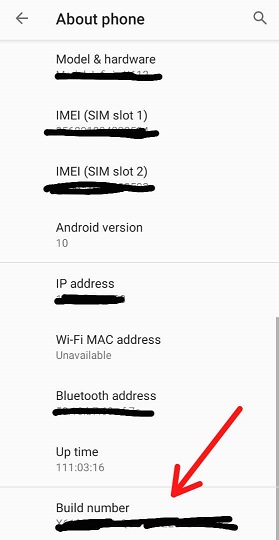
You must enable USB debugging on your device to use the ADB tool. Go to Settings → About phone → Software information, where you will find the “Build number” row at the bottom, as seen in the image below. Tap on it seven times, and this will return a message “You are now a developer.”
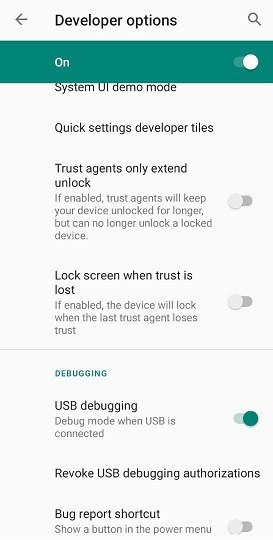
You can then return to Settings → Developer options to enable “USB debugging,” as displayed in the image below.
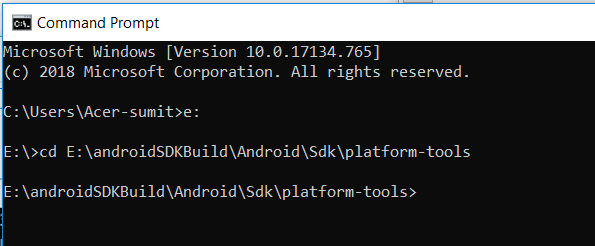
After successfully doing the above, visit the platform-tools folder under your Android SDK installation path folder and type cmd in the address bar to open the command prompt with the required path, as shown in the image below. Note: Android SDK installation path may vary.
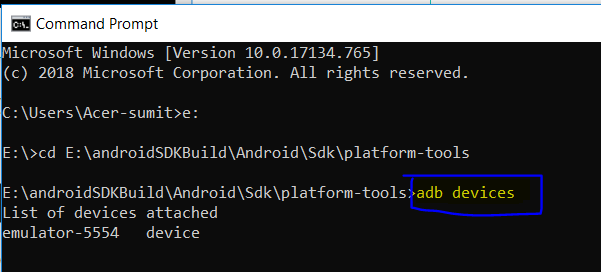
To check if your physical Android device is properly connected to ADB. Use the command adb devices as shown below.
Apply the following command below in the command prompt to use development server functionalities on your physical Android device.
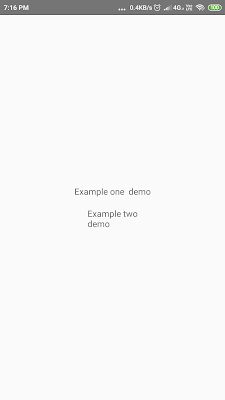
adb reverse tcp:8081 tcp:8081Now, visit your React Native project directory and apply the react-native run-android command in the prompt. If no issue occurs, you will get the following output (in my case) in your physical Android device, as shown in the image below.
In addition to these platform-specific debugging tools, several third-party tools and libraries can help streamline the debugging process for React Native apps. For example, Reactotron is a popular tool that provides a range of debugging features, including the ability to inspect state and props, log network requests, and view console output, more details on how to use Reactotron are in section 5. By using a combination of platform-specific and third-party debugging tools, you can ensure that your React Native app is running smoothly on both iOS and Android.
Session Replay for Developers
Uncover frustrations, understand bugs and fix slowdowns like never before with OpenReplay — an open-source session replay tool for developers. Self-host it in minutes, and have complete control over your customer data. Check our GitHub repo and join the thousands of developers in our community.
4) Debugging Network Requests
Debugging network requests is an important part of debugging React Native apps, and several tools can help. For example, you can use tools such as Charles or Fiddler to intercept and inspect network requests.
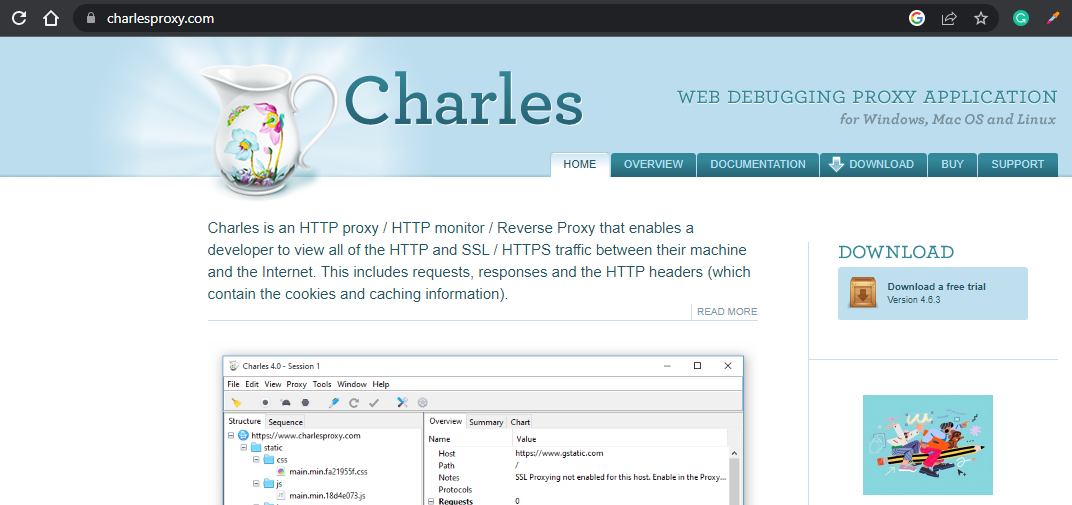
- Download and install either Charles or Fiddler on your computer. To download Charles Proxy go to https://www.charlesproxy.com. The image below displays the website where you can download the Charles tool.
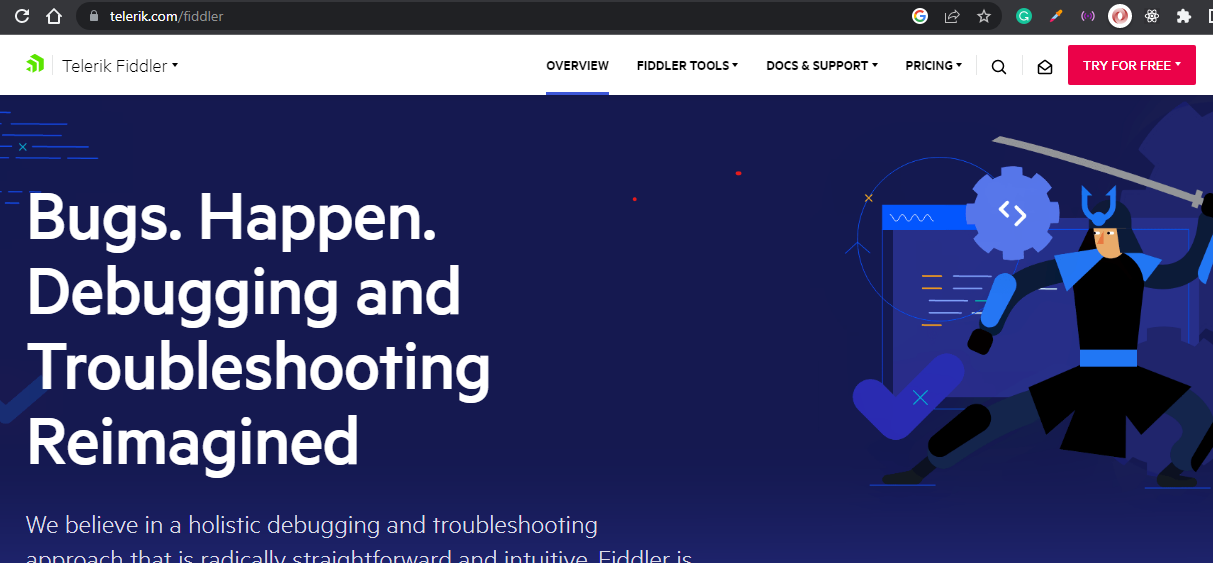
 To download Fiddler go to https://www.telerik.com/fiddler. The image below displays the website where you can download the Fiddler tool.
-
Start the tool and configure your device or emulator to use your computer as a proxy server.
-
In Charles, go to the “Proxy” menu and select “SSL Proxying Settings”. This is how the SSL Proxying Settings page looks
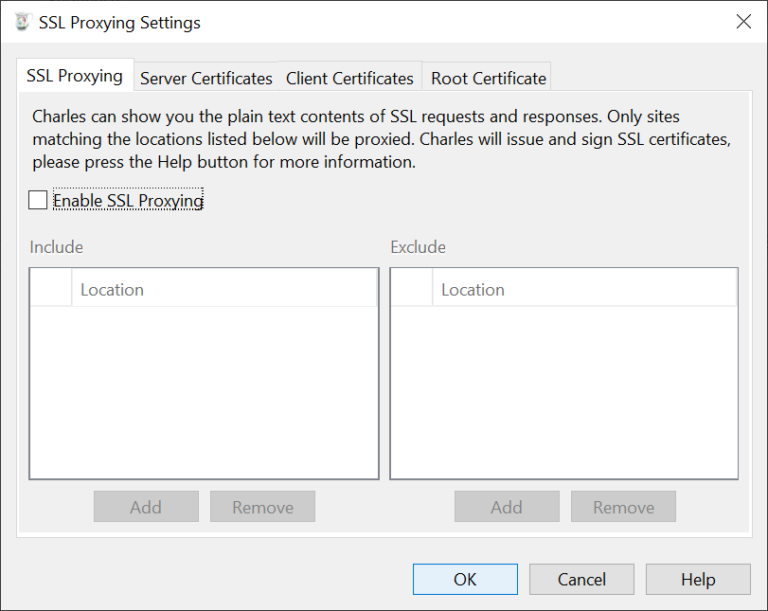 Tick the checkbox labeled “Enable SSL Proxying” in the above image and add the domain(s) you want to intercept to the “Include” list slightly below the checkbox.
- In Fiddler, go to the “Tools” menu and select “Fiddler Options” as displayed in the image below.
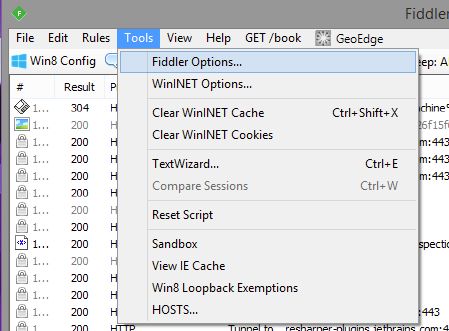 If done correctly, you will see the Fiddler Options menu display as in the image below.
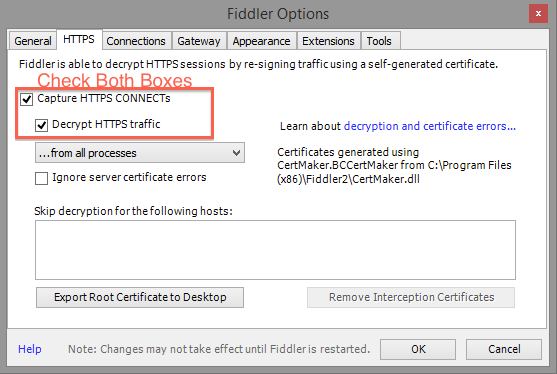 Under the “HTTPS” tab, enable the “Capture HTTPS CONNECTs” and “Decrypt HTTPS traffic” options by ticking their respective boxes, as shown in the above image.
-
On your device or emulator, open the app you want to inspect and perform the actions that trigger the network requests.
-
Charles or Fiddler should now show the network requests made by the app. You can inspect the request and response headers, payloads, and more.
-
In Charles, you can even edit the request and response contents before they are sent or received by the app.
Using Charles or Fiddler can help you understand how your app communicates with servers and identify potential issues, such as slow requests or incorrect data. It’s a valuable tool for any developer working with networked apps.
Alternatively, you can use the React Native Debugger’s network inspector to debug network requests directly from within the debugger.
When debugging network requests, it’s important to keep an eye on the request and response headers, as well as the status code and response body. You can also use tools such as Postman to test your API.
5. Use Reactotron for Debugging
Reactotron is a powerful debugging tool for React Native apps. It provides a rich interface for debugging your app, including the ability to inspect variables, monitor network requests, and view logs. Reactotron can be a valuable tool for debugging React Native apps, especially when combined with the React Native Debugger.
Steps to use Reactotron for debugging
- Install Reactotron by downloading it from the official website or using a package manager like npm
npm install --save-dev reactotron-react-native-
Start your React or React Native application.
-
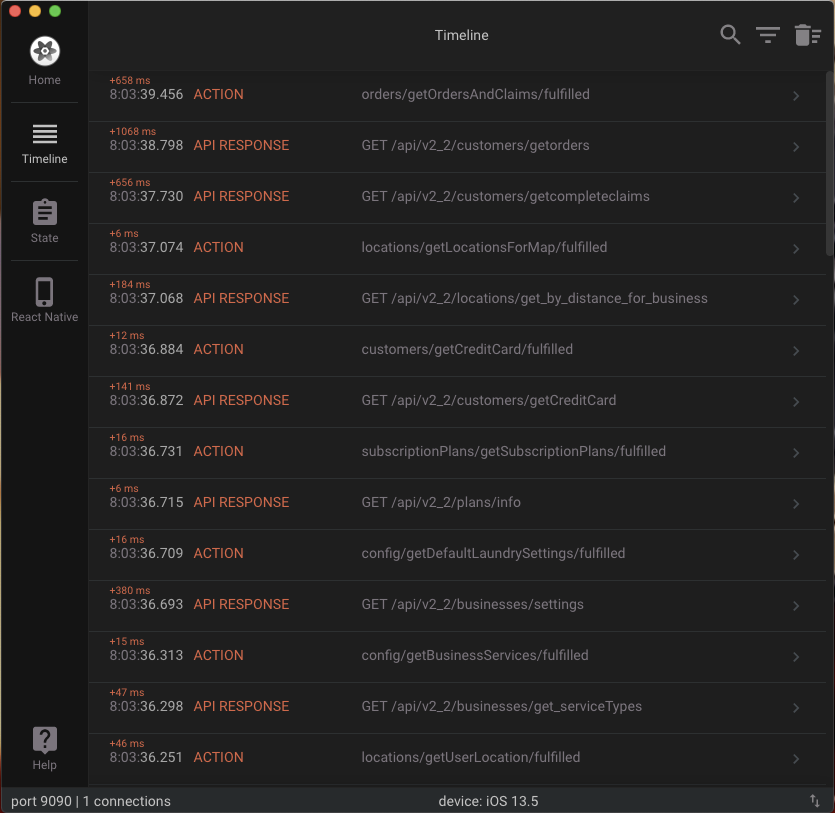
Open Reactotron and select the appropriate target for your app (React Native). When you open Reactotron, you will see something similar to the page displayed in the image below
-
Make sure that the device or emulator is connected to the same network as your computer.
-
In your code, add the following line of code to import Reactotron
import Reactotron from 'reactotron-react-native';- Next, initialize Reactotron by adding the following line of code before any other app code
Reactotron.configure().connect();Now, you can use the various features of Reactotron to inspect your app.
For example, you can view the state and props of components, monitor your app’s performance, view network requests and responses, and log custom messages.
Reactotron also supports plugins that add additional features, such as inspecting Redux stores or viewing database contents.
Conclusion
Debugging is a critical process in software development that ensures the quality and reliability of the final product. React Native is a powerful framework that allows developers to build high-performance mobile applications with ease, but it can be challenging to debug. By following the five best practices outlined in this article, developers can improve their debugging skills and streamline their development process. By implementing the practices mentioned above, developers can save time and resources, improve the quality of their applications, and ultimately deliver a better user experience.

