Front-end monitoring with Sentry.io and React

In this article, let’s take a closer look at front-end monitoring: what it is, why it is important, and we can get started integrating it using Sentry.
What is Front-End Monitoring
Simply put, front-end monitoring is the set of processes and tools used to track the performance of a website or app.
Front-end monitoring primarily focuses on the parts that the end user sees. These include issues such as:
- Slow rendering
- Inconsistent or unresponsive user experience
- Network requests/API errors
- Framework-specific issues
Importance of Front-End Monitoring
As websites are becoming more powerful and complex, the maintenance of its performance becomes increasingly difficult.
Front-end performance is a part of user experience. The perception of a business’ quality is often what the user first sees and experiences through its website. Any inconsistencies, downtime or errors on the client can lead to a loss of trust and credibility of a website. Therefore, front-end monitoring is an essential part in developing strong and robust websites and apps.
Getting Started with Sentry for React
Fortunately, there are currently some powerful tools such as Sentry to track, record and monitor front-end performance. It is an open-source error tracing tool that supports various languages and frameworks such as Java, PHP, Ruby, React, Rust, Unity, etc.
In this tutorial, let’s set up and start monitoring a React app with Sentry.
Step 1: Set up a Sentry Project
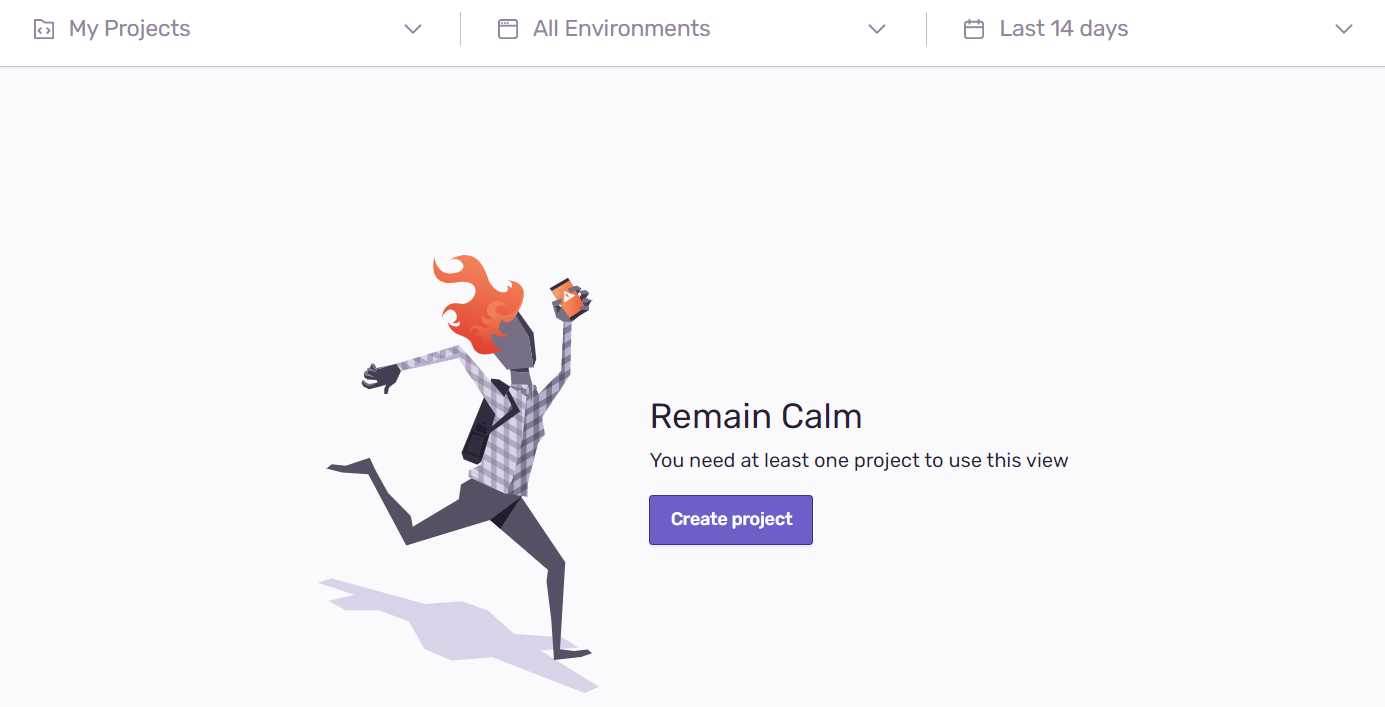
Create a free Sentry account at sentry.io. After creating an account, click the Create project button.
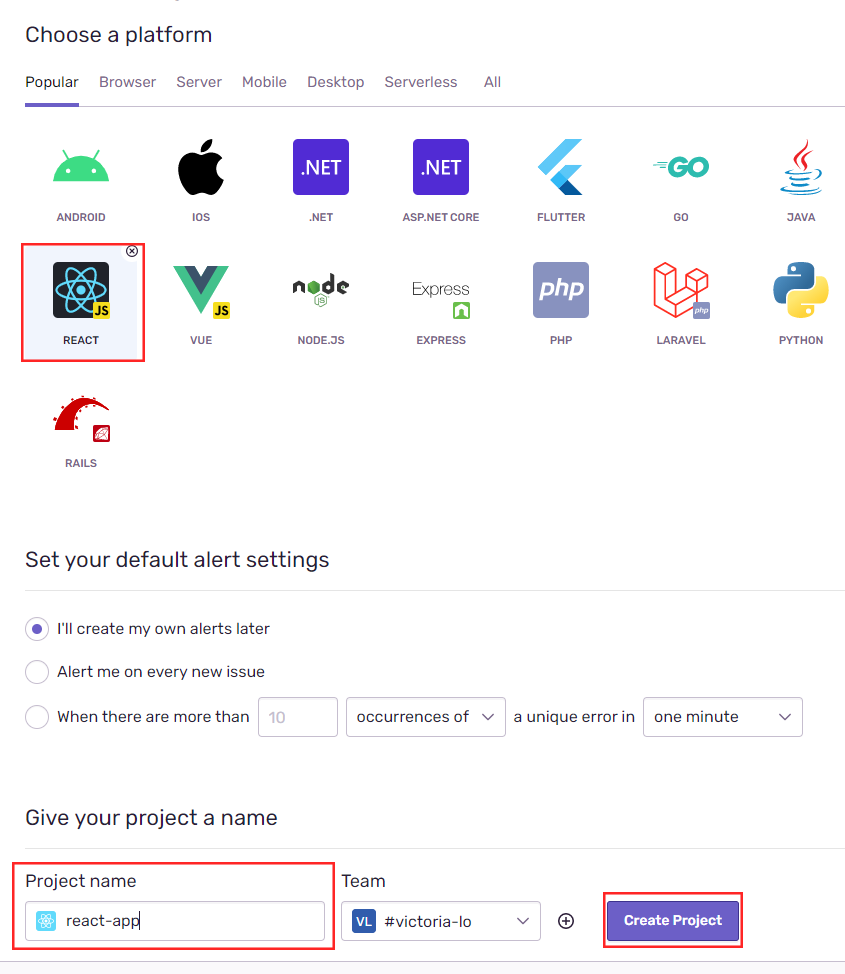
Now, select React as the platform of our project and enter a project name. Click Create Project to finish setting up a new Sentry project.
Step 2: Install Sentry SDK
In a React app, we can integrate Sentry by installing its SDK with the following command:
npm install @sentry/react @sentry/tracingImport the installed packages in your React’s app index.js file like so:
import * as Sentry from "@sentry/react";
import { Integrations } from "@sentry/tracing";
Step 3: Configure Sentry in React app
In order for Sentry to connect to our React app, we need to configure our SDK with our client key, also known as the Sentry DSN (Data Source Name) value.
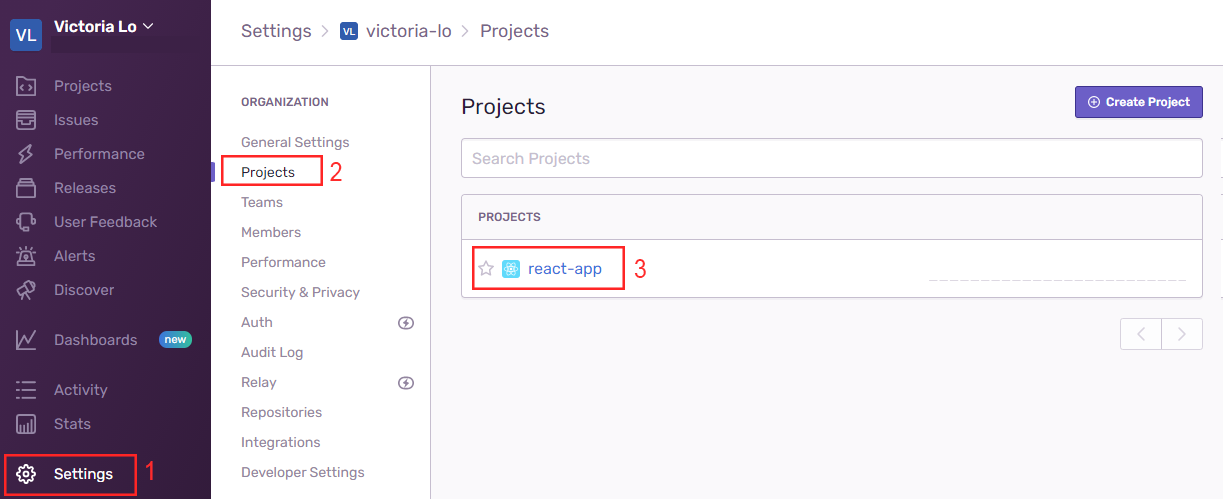
To get our client key, simply navigate to Settings > Projects > {Your Project Name}, as shown in the screenshot below.
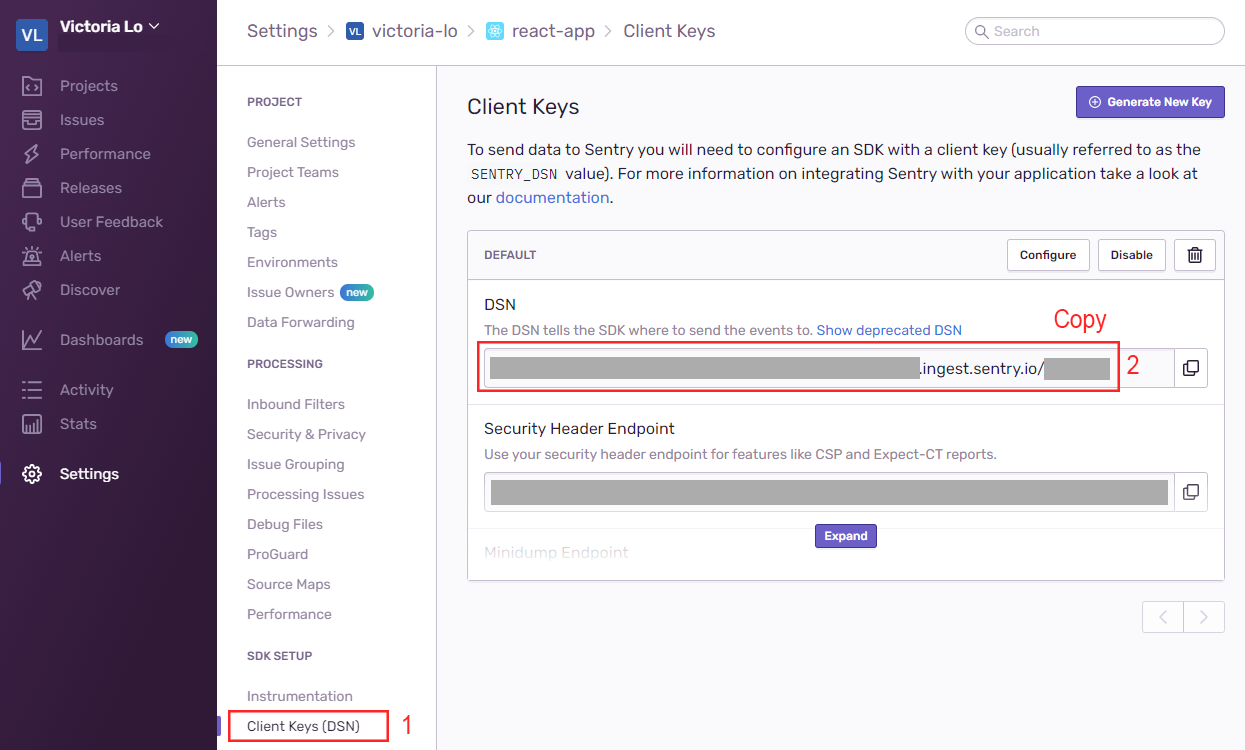
Then, click on Client Keys (DSN) and copy the DSN value.
Back in your App’s index.js file, add the Sentry.init() method below the import statements to connect the app to your Sentry project. Your index.js file should look something like:
import React from "react";
import ReactDOM from "react-dom";
import * as Sentry from "@sentry/react";
import { Integrations } from "@sentry/tracing";
import App from "./App";

//Add these lines
Sentry.init({
  dsn: "Your DSN here", //paste copied DSN value here
  integrations: [new Integrations.BrowserTracing()],

  tracesSampleRate: 1.0, //lower the value in production
});

ReactDOM.render(<App />, document.getElementById("root"));
About SampleRate
While testing, it is okay to keep the tracesSampleRate as 1.0. This means that every action performed in the browser will be sent as a transaction to Sentry.
In production, this value should be lowered to collect a uniform sample data size without reaching Sentry’s transaction quota. Alternatively, to collect sample data dynamically, tracesSampler can be used to filter these transactions.
More about sampling options can be found at the documentation here.
Step 4: Test Integration
Once we’ve configured our app, we may test whether our integration is successful with a simple button:
return <button onClick={methodDoesNotExist}>Bad Button</button>;If we run our app, we would get the following error:

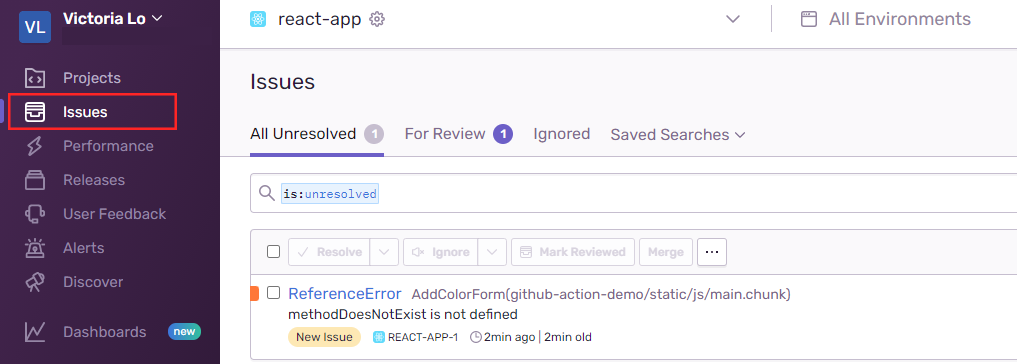
Now, let’s check our Sentry dashboard to see if the error has been properly traced. As seen in the image below, the ReferenceError is there.
Step 5: Capture Custom Errors
Besides capturing errors from React, Sentry can capture errors that are specified within the app too.
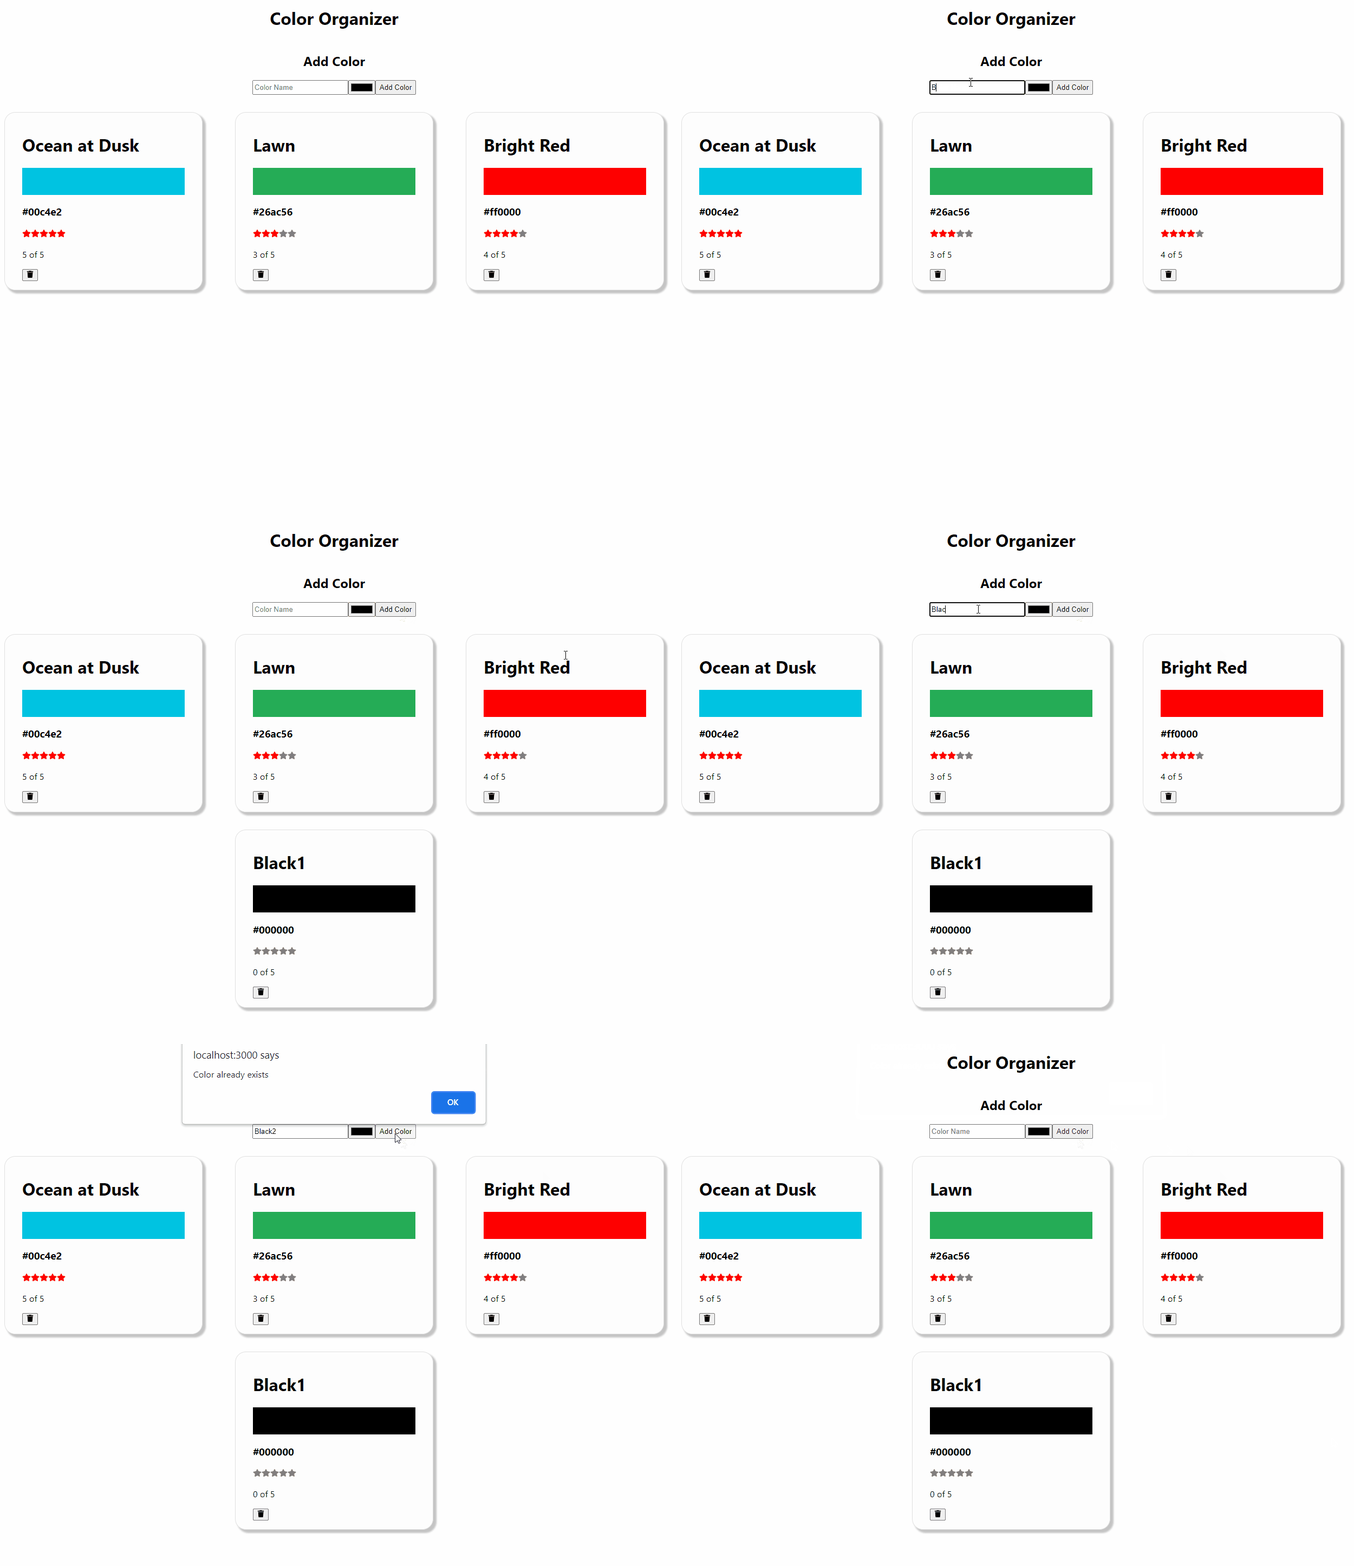
For example, in my Color Organizer React app, I want to throw an error if the user adds the same color twice. As seen in the clip below, it currently only shows an alert window.
So let’s add a throw statement to the addColor function to throw an error when there’s a duplicate color:
const addColor = (title, color) => {
    if (colors.some((c) => c.color === color)) {
      throw "Color already exists"; // add a throw statement
    } else {...}
And then, we simply add a try-catch statement when calling this function. We need to use Sentry.captureException() so it will be captured as a transaction and sent to Sentry.
First, let us import the package to use Sentry in our App.js file:
import * as Sentry from "@sentry/react";In the function where the addColor function is called, we add the try-catch statement like so:
try {
    addColor(title.value, color.value);
} catch (e) {
    Sentry.captureException(e);
    console.error(e);
}
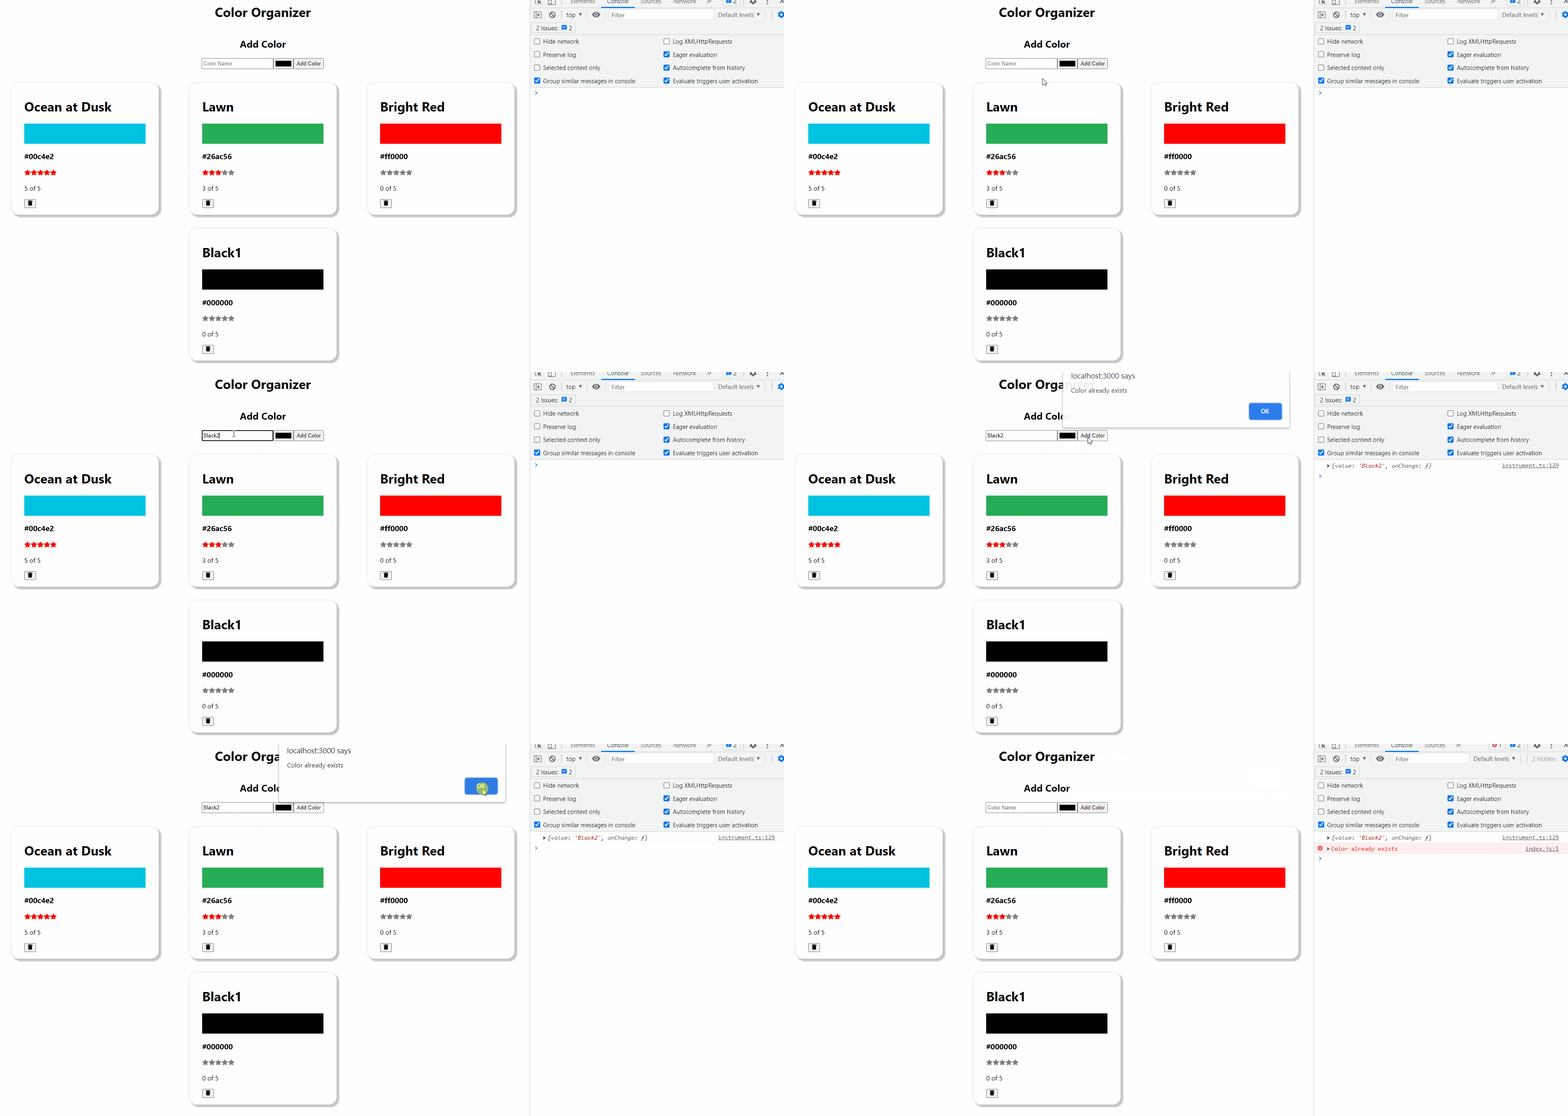
Now, if we add a new Color with the same color code, an error will be thrown and sent to Sentry.
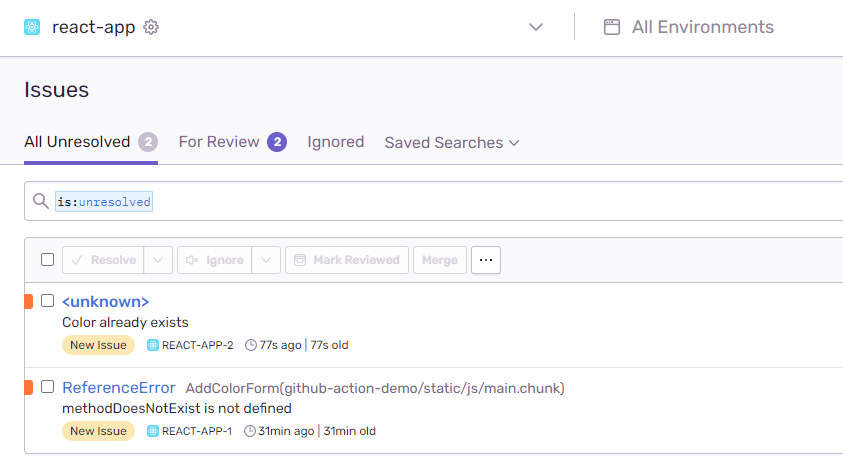
In our Sentry Dashboard, under Issues, we can see the custom error we have captured.
Enable Performance Monitoring
In addition to error tracking, we can enable performance monitoring in our Sentry dashboard by wrapping Sentry.withProfiler() in our App component in its export statement.
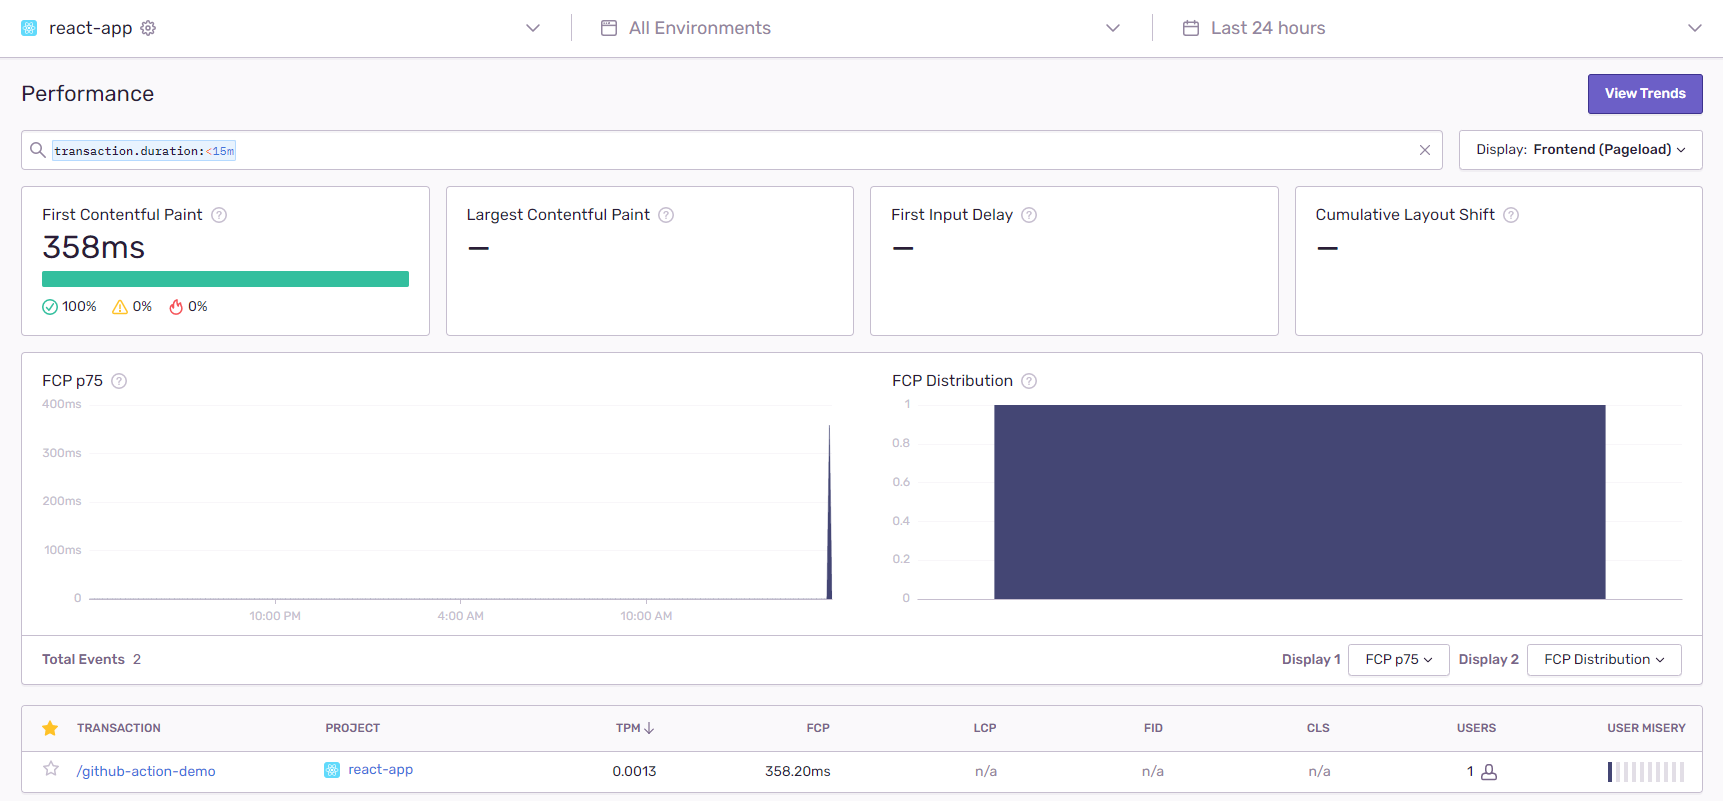
export default Sentry.withProfiler(App);Navigate to the Performance tab to monitor and measure important metrics such as the FCP (First Contentful Paint), latency or downtime of any API requests, etc.
Open Source Session Replay
OpenReplay is an open-source, session replay suite that lets you see what users do on your web app, helping you troubleshoot issues faster. OpenReplay is self-hosted for full control over your data.
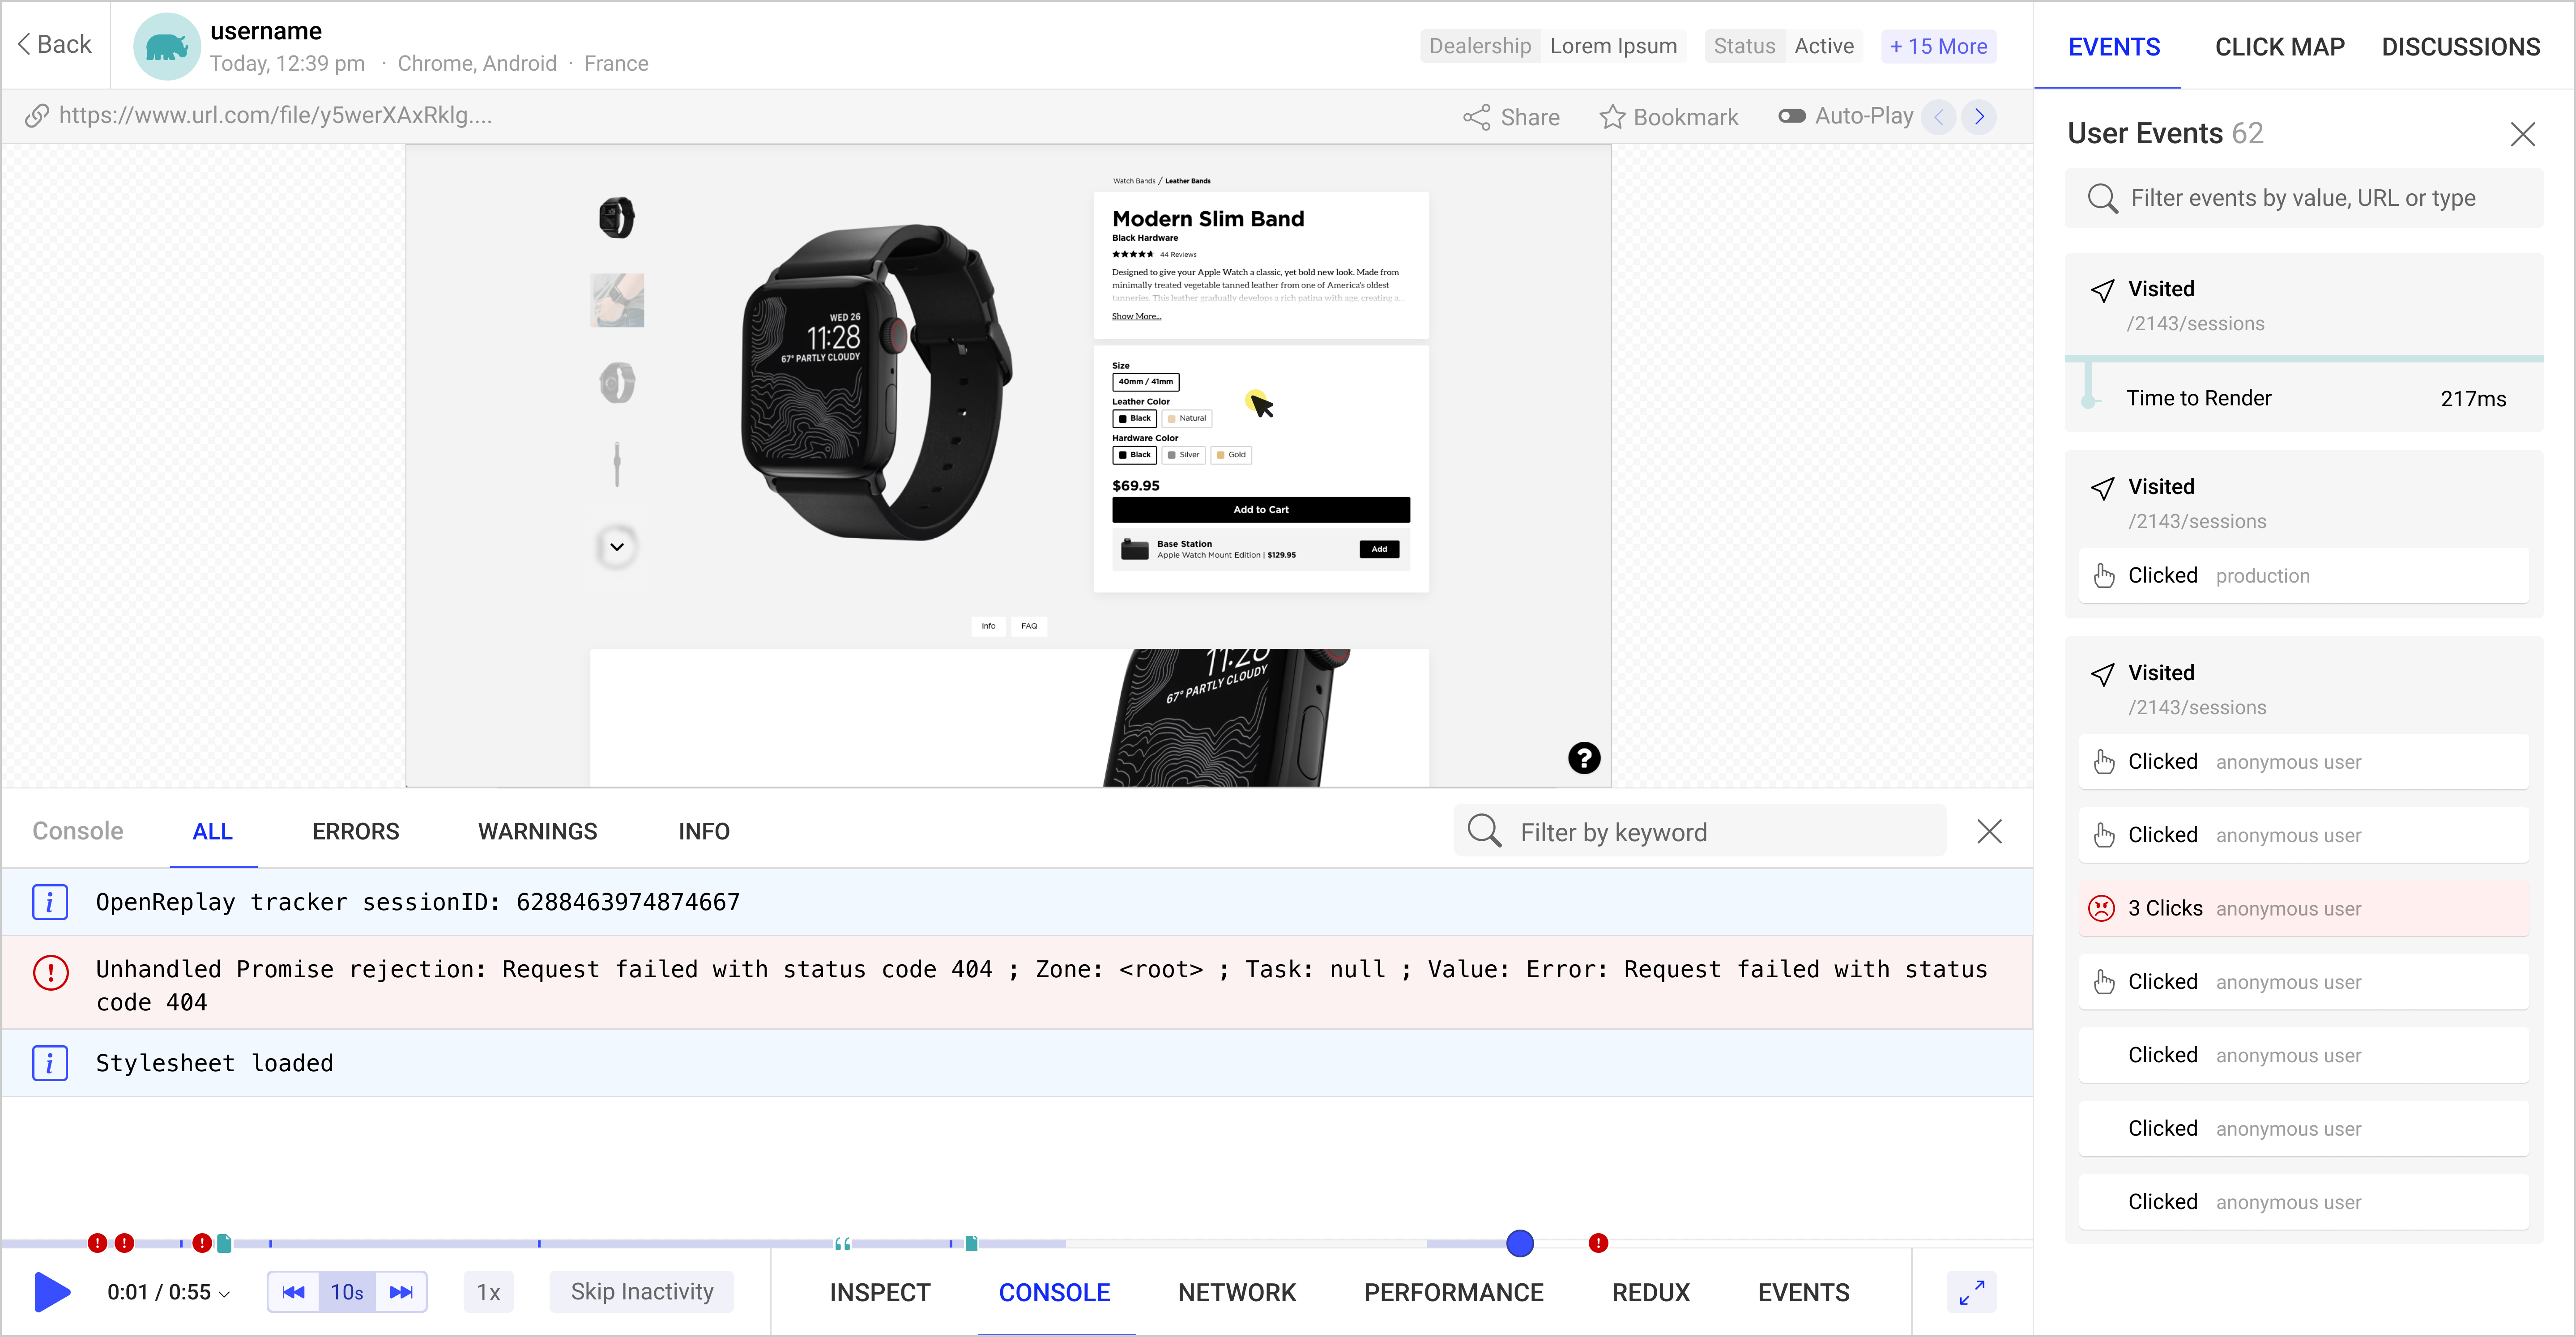
Start enjoying your debugging experience - start using OpenReplay for free.
Conclusion
Without a doubt, front-end monitoring has gradually become prevalent in web development practices today. Powerful tools such as Sentry can provide useful insights and error management to enrich the user experience.
What’s even more powerful is the fact that OpenReplay integrates with Sentry, which allows for replayed activities to be sent for faster and easier debugging. To learn more about how to integrate OpenReplay with Sentry, please visit this link.
Thank you for reading. I hope this article has been helpful in getting you started with front-end monitoring and Sentry.


