How to Open Chrome DevTools: 4 Fast Methods with Keyboard Shortcuts

Why do developers waste 11 seconds per debugging session fumbling for DevTools? This guide shows four reliable ways to open Chrome’s developer tools, including keyboard shortcuts and permanent toolbar access that survives browser restarts.
Key Takeaways
- Use Ctrl+Shift+I (Windows/Linux) or Cmd+Opt+I (Mac) for instant access
- Enable permanent toolbar access through Chrome’s settings
- Open tools directly to specific panels like Elements or Console
Method 1: Keyboard Shortcuts (Fastest)
Primary shortcut:
- Windows/Linux: Ctrl + Shift + I or F12
- Mac: ⌘ + ⌥ + I
Panel-specific shortcuts:
- Elements panel: Ctrl + Shift + C (Windows) / ⌘ + ⌥ + C (Mac)
- Console panel: Ctrl + Shift + J (Windows) / ⌘ + ⌥ + J (Mac)
Method 2: Right-Click Inspection
- Right-click any page element
- Select Inspect from context menu
Method 3: Chrome Menu Navigation
- Click ⋮ (More Tools)
- Navigate to More Tools > Developer Tools
Useful when keyboard isn’t available
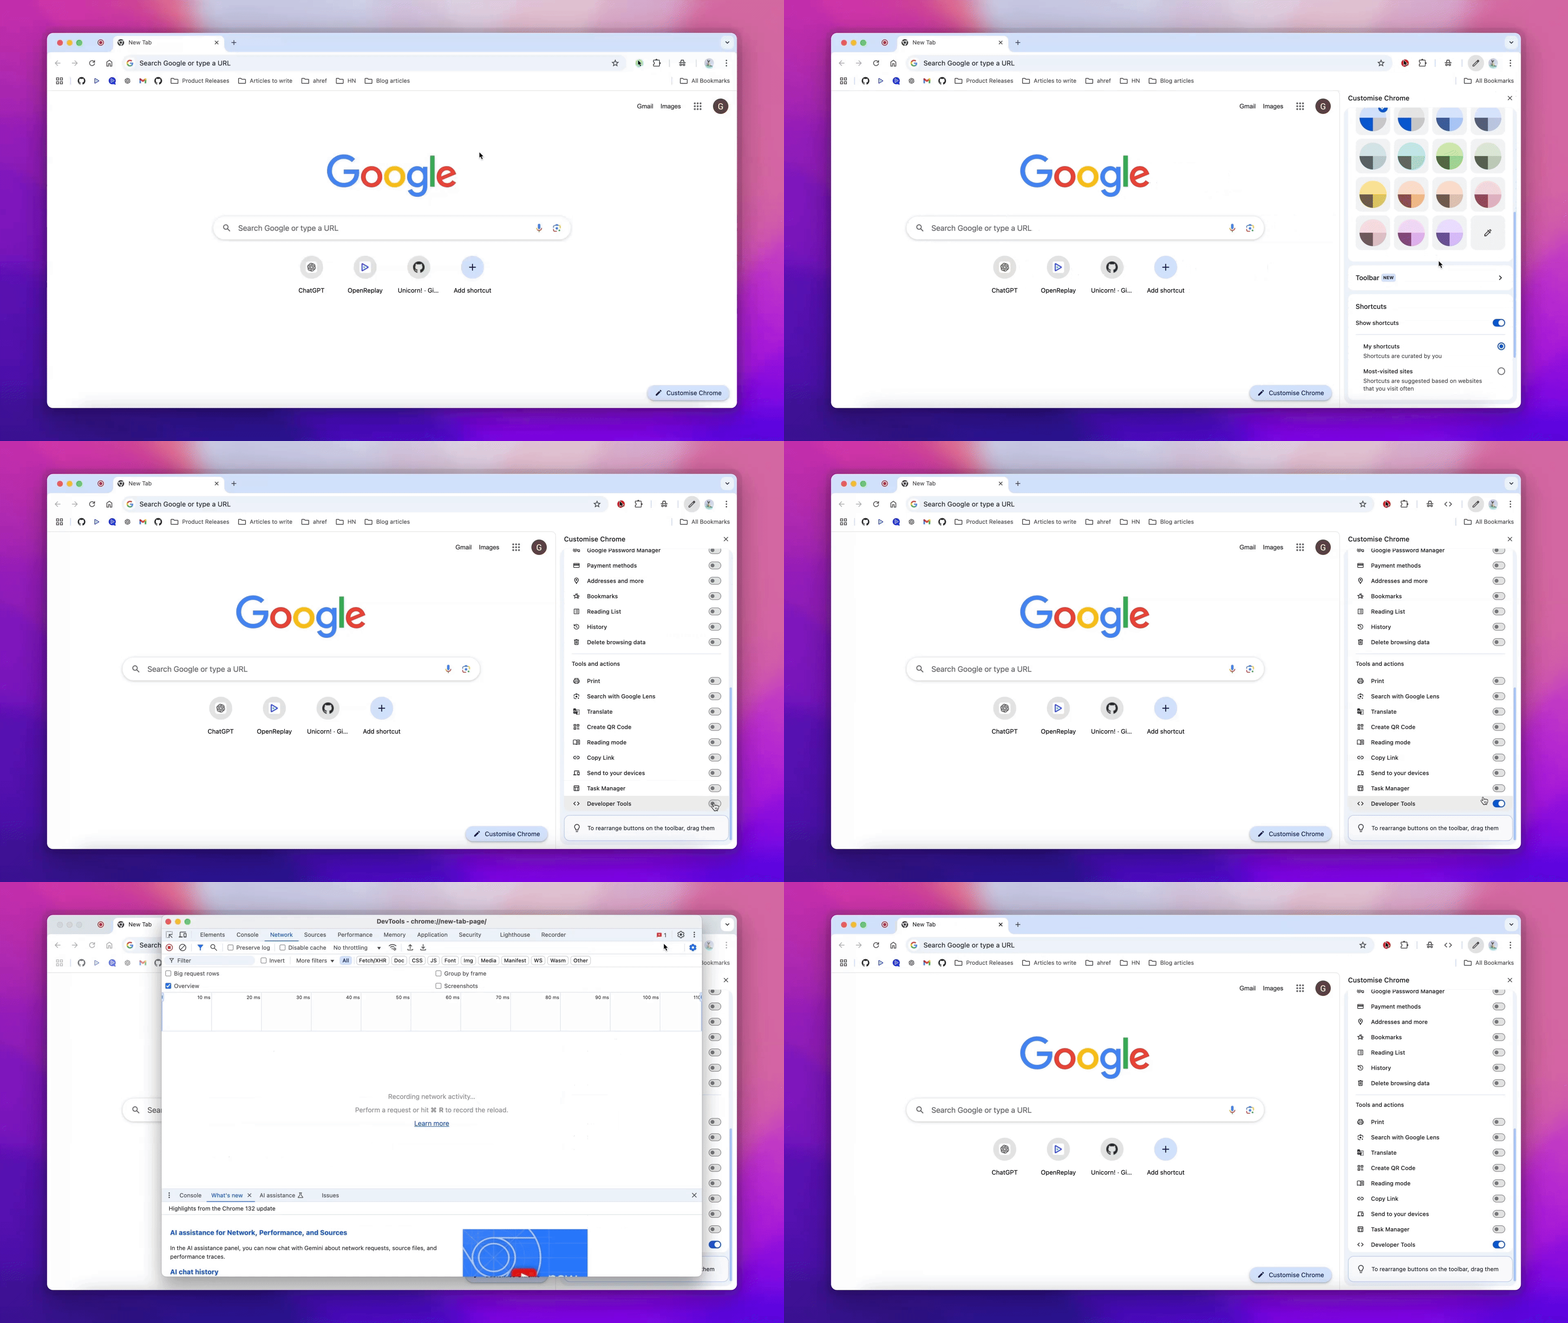
Method 4: Permanent Toolbar Access
Enable DevTools in Chrome’s toolbar for one-click access:
- Open a new window
- Click the Edit button (pen icon) in bottom-right corner
- Select Toolbar from left menu
- Scroll down and toggle Developer Tools ON

FAQs
Use Method 4 to enable the toolbar icon - it persists across all tabs and windows until disabled
Check for browser extensions overriding shortcuts or reset mappings in chrome://settings/shortcuts
Yes - press Ctrl + Shift + J (Windows) or ⌘ + ⌥ + J (Mac) to open Console in drawer mode
Yes - toolbar settings apply to all browsing modes
Conclusion
Master these four DevTools activation methods to optimize your debugging workflow. The new toolbar toggle (Method 4) provides persistent access for frequent users, while keyboard shortcuts remain the fastest option for power users. For element-specific debugging, remember Ctrl/Cmd+Shift+C opens the Elements panel directly.


