Delight Your Users: Optimize Interaction to Next Paint (INP)

Have you ever wondered why your site feels slow but can’t figure out why? Interaction to Next Paint (INP) can help with that. In this article, you’ll learn everything about INP and how to optimize it on all your site’s pages.

Discover how at OpenReplay.com.
Google’s Core Web Vitals help you quantify the quality of your site’s user experience (UX). INP is the Core Web Vital that measures page responsiveness, giving you a framework to improve it. So, what’s that? INP is a Core Web Vital measuring the longest time a webpage takes to give visual feedback to user interactions. You can think of it as a metric for how responsive a webpage is. The smaller a page’s INP, the better.
Let’s go into a bit more detail. You can split an INP score into three components:
- Input Delay: The time from the start of the interaction to when event handlers start running
- Processing Time: The amount of time it takes the event handlers to run
- Presentation Delay: The gap between the event handlers finishing their run and the browser repainting.
INP is a recent Web Vital that Google launched in March 2024. It replaced a metric called First Input Delay (FID) that measured the input delay (the first component of INP) of the first user interaction on the page.
INP replaced FID because it’s a more comprehensive metric. It considers Processing Duration and Presentation Delay and measures the highest delay for all page interactions, not just the first.
But what counts as an interaction? An interaction is one of the following events:
- pressing a key in an input
- clicking an interactive element with a mouse
- tapping the screen on devices with a touchscreen
Now that you know what INP is, what’s a good score? A page INP at or under 200ms is considered good, under 500 needs improvement, and a score above 500 is poor.
 Source: web.dev
Why should you even care about INP? First, Google measures it, and a terrible INP (or other Vital metrics) score will hurt your site’s SEO, although there’s no public data on how much.
The other reason is that if your site’s INP needs work, your users probably aren’t having a great time - interacting with an unresponsive site is frustrating.
Measuring INP
There are two ways to measure INP:
- In the lab, which involves measuring INP by interacting with your site under specific conditions meant to simulate real-world usage
- In the field, which involves adding JavaScript to your website to measure the INP your users experience.
Field data is critical because INP is partly device-dependent; a higher-end computer will run code faster, and an interaction that’s fine for you may be laggy for some of your users.
Measuring INP in the lab
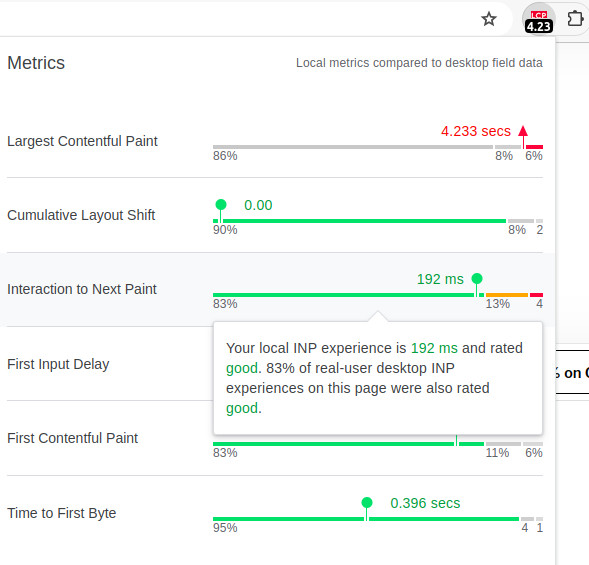
The easiest way to get lab data for INP is to use the Web Vitals Chrome extension or the Chrome DevTools.
Remember, INP only accounts for interactions that the user performs. This means if the interactions you perform in the lab don’t closely mimic actual user interactions, the INP you’ll measure won’t be representative of your users’ experience.
Ideally, you should mimic the most common or critical user flows through the page in the lab.
With that in mind, here’s how to measure INP with the Chrome DevTools:
- Open Chrome in a guest profile to remove the potential impact of any extensions you have installed
- Navigate to the page on your site, open DevTools, then click on the Lighthouse panel. Then, set the mode to Timespan and uncheck all categories except performance.
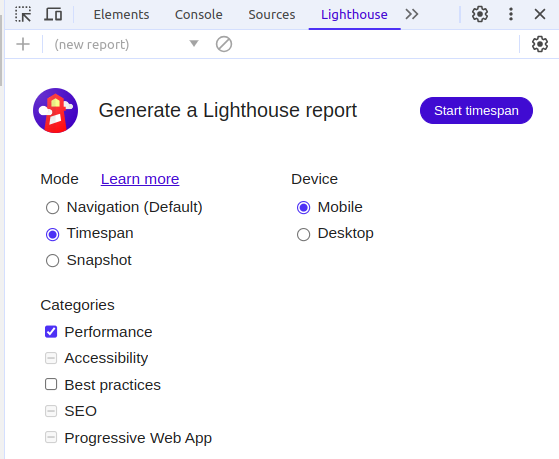
- When prompted, Click the start timespan button and interact with your page.
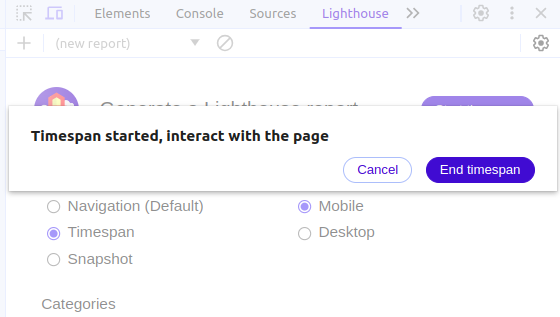
- Once done, click the end timespan button and wait for the results.

Using the web Vitals extension is nearly automatic. Install it and interact with the page, then click the icon in your extension bar to see the measured Core Vitals.
Measuring INP in the field
To get field INP data, you have a few options:
- Google’s web-vitals library lets you get detailed field data for all the Core Web Vitals, including INP.
- Real User Monitoring (RUM) tools. RUM tools collect data on how your users use your app and their experience with it. INP is part of the data these tools collect for you, although most of those tools aren’t free.
- The Chrome User Experience (CrUX) report may contain field data INP for pages on your site if they’re eligible.
In this article, we’ll be showing you how to collect field data with the web-vitals library:
First, install web-vitals. The recommended method is via npm, but you can also install it from a CDN.
To install web-vitals from npm, run the following in your terminal inside your app’s directory:
npm install web-vitalsThe web-vitals library has two different builds you can choose from: the standard build and the attribution build. The standard build is a sub-package that collects basic data about the core web Vitals of your site. The attribution build collects more in-depth data, so that’s the build we’ll be using.
To collect INP data with the attribution build, add the following JavaScript to your project:
import { onINP } from "web-vitals/attribution"The onINP function allows you to get your page’s INP. Its only parameter is a callback function that will be run when the library is ready to report an INP score for that page.
onINP should only be called once per page load to avoid performance issues. It will monitor the page’s INP throughout its lifetime and fire the callback function again whenever necessary.
To give you the data it collects, onINP passes an object to your callback function that contains three properties: name, value, and rating.
These properties tell you the name of the metric(INP), the calculated value, and whether or not the calculated value is good enough. The rating property will either be good, needs improvement, or poor.
When you use the attribution build, onINP will add a fourth property called attribution. The attribution property is an object that has detailed information about the interaction used to calculate the INP score.
Here’s an abridged list of the properties the attribution object has:
| Property | Purpose |
|---|---|
interactionTarget | A CSS selector that describes the element that was the target of the interaction used to calculate INP |
interactionTime | The time that the interaction started |
interactionType | The type of interaction that occurred |
inputDelay | The interaction’s input delay component |
processingDuration | The interaction’s processing delay component |
presentationDelay | The interaction’s presentation delay component |
longAnimationFrameEntries | An array of objects containing information about LongAnimationFrames(LoAF), which are updates to the screen that the browser takes longer than 50ms to render |
You can find a complete property list here.
The last thing you need is a callback function that sends the measured data to an endpoint. Here’s an example:
onINP(({ name, value, rating, attribution }) => {
  //collect INP data into an object and marshal to JSON
  const inpData = JSON.Stringify({ name, value, rating, attribution });

  // use navigator.sendBeacon to asynchronously send a POST request
  // to the specified endpoint without waiting for a response
  navigator.sendBeacon("server/analyticsEndpoint", inpData);
});
Optimizing INP
Optimizing a page’s INP comes down to repeatedly finding the slowest interactions and making them faster.
The ideal way to find slow interactions is by collecting field data. Lab measurements are limited, meaning you might fix some slow interactions but miss the worst, and your page’s INP won’t improve. Failing that, you can try to find slow interactions by manually auditing the common interactions on your page.
Once you’ve found a slow interaction, your next step is to profile the problematic interaction using the Chrome DevTools to diagnose the cause of the lag. Profiling an interaction requires the following steps:
- Start a guest profile in Chrome and navigate to the page you need.
- Open DevTools, switch to the performance panel, and then hit record.
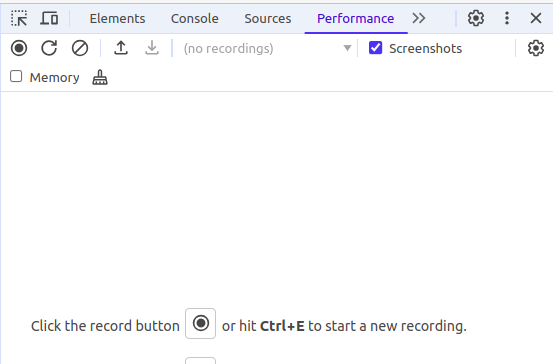
- Perform the slow interaction, then hit the stop recording button.
Once you’re done, the panel will be filled with a colorful graph like the one below.
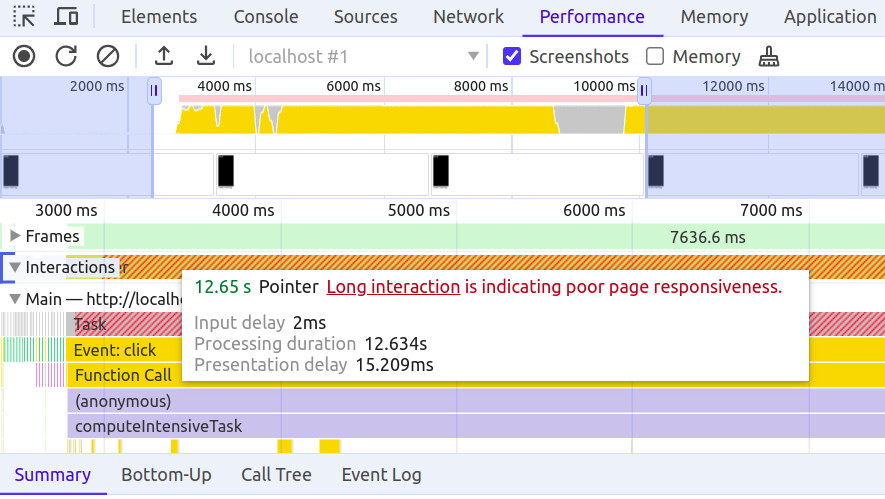
You should see a section near the middle of the panel called “Interactions.” The bars in this section represent interactions you performed during the profiling, and the length of the bars is proportional to the length of the interaction.
Hovering over an interaction will show you the total time it took and the components of that time.
The colored blocks in the “main” section beneath it represent the tasks that were executed while the interaction was in progress.
At this point, you should be able to pinpoint which component of INP is causing the bad score, and the blocks in the main section should help you identify what code is taking the longest to run.
There are no one-size-fits-all solutions for optimizing slow code. That said, here are some common causes of slow interactions organized by the component of INP they affect:
Common causes of a long Input Delay
Understanding what typically causes long input delays can help you identify and address these issues more efficiently. Here are some common culprits:
- Excessive recurring work in the browser’s main thread due to SetTimeout or SetInterval.
- Interaction overlap - when successive interactions occur within a very short time (like a user typing multiple letters), the processing of prior interactions can delay the processing of successive ones, inflating the INP.
Common causes of a long Processing Duration
Long processing durations can significantly impact your page’s responsiveness. Below are some frequent reasons for extended processing times:
- Code that does intense computation or long network requests without yielding so the browser can schedule other tasks.
- Code that forces the browser to perform many layout calculations.
Common causes of a long Presentation Delay
Presentation delays occur when the browser takes too long to display changes on the screen. The following are typical factors contributing to long presentation delays:
- The page has a huge DOM.
- Rendering a lot of the page’s HTML using JavaScript.
Conclusion
In this article, you learned what INP is, why it’s essential, and how it’s calculated. You also learned how to measure it in the lab, how to measure it in the field, and how to optimize it. Thanks for reading, and happy coding!
Gain control over your UX
See how users are using your site as if you were sitting next to them, learn and iterate faster with OpenReplay. — the open-source session replay tool for developers. Self-host it in minutes, and have complete control over your customer data. Check our GitHub repo and join the thousands of developers in our community.


