
Qualitative vs. Quantitative Data: Key Differences, Methods, and Examples


“Numbers have an important story to tell. They rely on you to give them a clear and convincing voice.” But how do we uncover these stories?
It starts with understanding the difference between qualitative and quantitative data.
Whether you are conducting research or developing a product, knowing the differences is key to better understanding your data and your customers.
In this article, we will study the differences between qualitative and quantitative data, examine their collection methods, look at real-world examples, and show how they work together to provide a complete picture and guide strategic decisions.
In this article
- What is qualitative data?
- What is quantitative data?
- Qualitative vs quantitative data: key differences
- Qualitative vs quantitative data: collection methods
- Qualitative vs quantitative data: examples
- When is qualitative data useful vs. quantitative data is useful?
- Qualitative vs quantitative data: benefits and limitations
- Why choose OpenReplay for your qualitative and quantitative data collection needs?
What is qualitative data?
Qualitative data, derived from the term “quality,” is non-numerical information that describes the characteristics, attributes, or properties of a subject. It uses words to detail experiences, thoughts, feelings, behaviors, and interactions.
This type of data provides personal insights, helping us understand the reasons behind people’s actions and opinions. It is subjective and open to interpretation in different ways.
What is quantitative data?
Quantitative data, derived from the term “quantity,” is numerical information that describes quantities and measurements. It uses numbers to present amounts, frequencies, and statistics.
This type of data provides clear and factual information by capturing measurable details. It is objective and less open to interpretation.
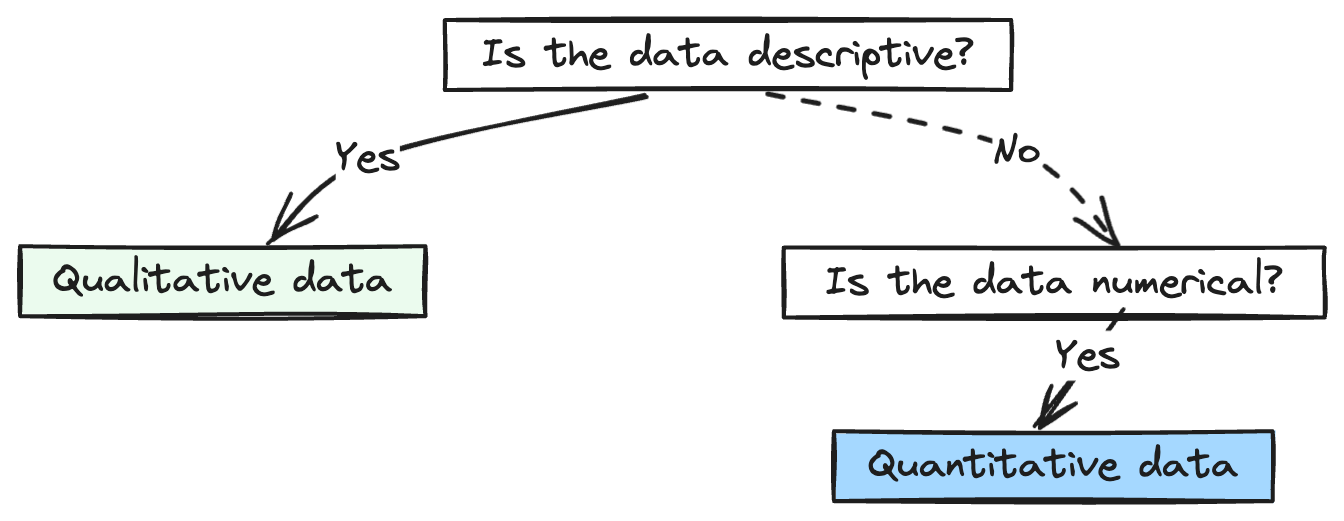 Illustration by OpenReplay team
Qualitative vs quantitative data: key differences
Qualitative and quantitative data serve different purposes, use distinct collection and analysis methods, and reveal different types of information.
1. What are the primary purposes of qualitative vs. quantitative data?
The primary purpose of qualitative data is to understand experiences, behaviors, motivations, and perspectives. It is meant to answer questions like “why?”, “how?” and “what are the underlying reasons?”
On the other hand, the primary purpose of quantitative data is to provide numerical information that can be measured and quantified. It answers questions like “how many?”, “how often?” and “what is the relationship between variables?“
2. How do their data collection methods differ?
Qualitative data collection methods gather descriptive information to understand experiences and perspectives. Methods include interviews, focus groups, and session replays.
Quantitative data is collected through methods that focus on measuring and counting to produce numerical data. Methods include surveys, data analytics tools, and experiments.
3. What types of data are used in each?
When you hear qualitative data, think words, non-numerical, often involving the five senses. Examples include text, audio, video, images, and artifacts.
When you hear quantitative data, think numbers, precise, countable, and measurable information. Examples include percentages, statistics, measures, and counts.
| Qualitative data | Quantitative data | |
|---|---|---|
| Type of data | Descriptive data | Numerical data |
| Examples | Text, audio, video, images, artifacts, sensory descriptions | Percentages, statistics, measures, counts |
| Categories | -- | - Discrete data (countable values) - Continuous data (measurable values) |
4. How to analyze qualitative vs. quantitative data
Since qualitative and quantitative data differ, so do the ways of analyzing them. Raw data can’t tell us much until it is analyzed using suitable methods. Think of raw data as a gold mine- analyzed data is the gold we extract.
Qualitative data analysis methods:
Qualitative data analysis relies on decoding text, observations, and narratives to identify patterns and themes. Common methods include:
- Thematic analysis: finding recurring themes in data.
- Content analysis: categorizing text into predefined categories.
- Narrative analysis: analyzing stories to understand experiences.
- Observational analysis: studying behaviors in natural settings.
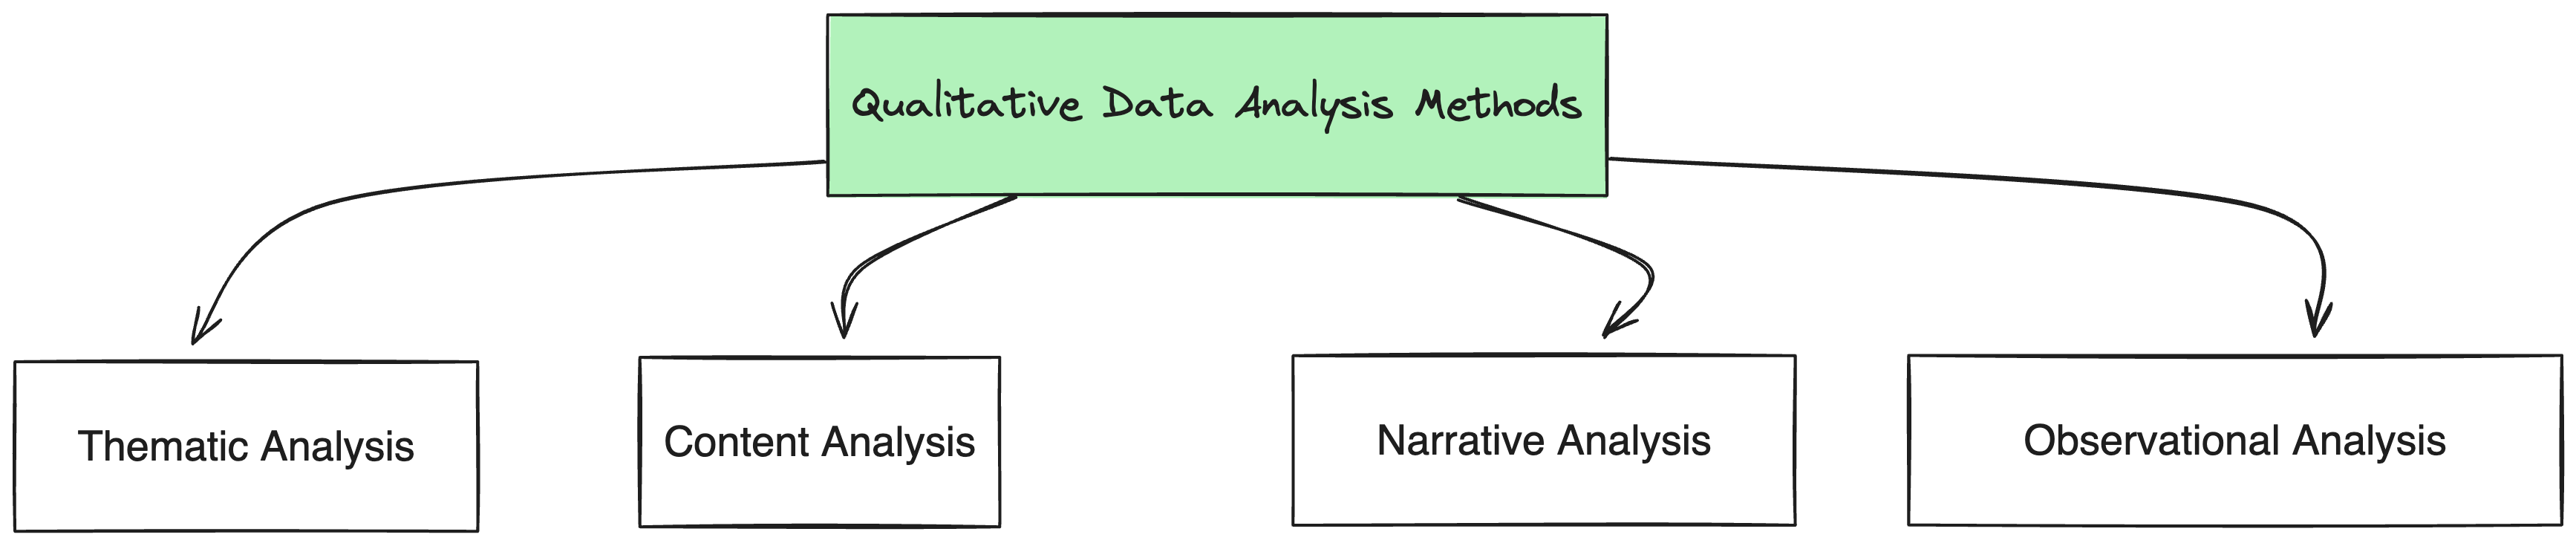 Illustration by OpenReplay team
Quantitative data analysis methods:
Quantitative data analysis relies on decoding numbers and making sense of them through statistical methods. Common methods include:
- Descriptive statistics: summarizing data using measures like mean and median.
- Inferential statistics: making predictions or inferences from sample data.
- Data visualization: creating charts and graphs to represent data.
- Statistical software: using specialized software for statistical analysis.
- Correlation and regression analysis: studying relationships between variables.
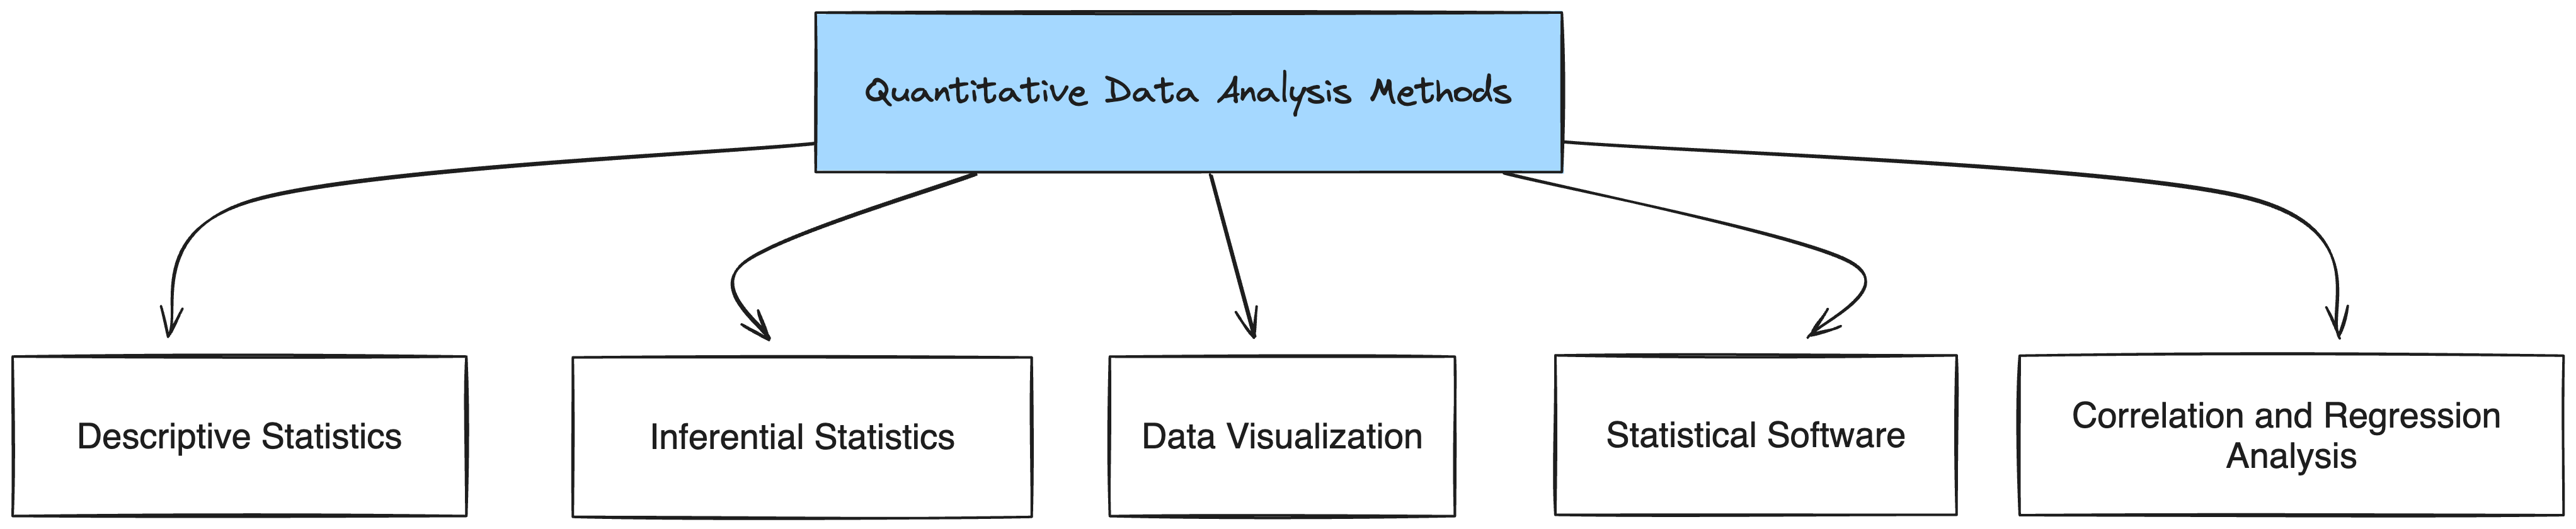 Illustration by OpenReplay team
Qualitative vs quantitative data: collection methods
Everything that collects non-numerical data, such as words and observations, is a means of collecting qualitative data. By contrast, anything that produces numbers is a method of collecting quantitative data.
According to the book Educational Research: Quantitative, Qualitative, and Mixed Approaches, qualitative and quantitative data collection methods each bring valuable perspectives.
We collect qualitative data using a variety of methods, including:
- Interviews, or surveys with open-ended questions: allow for detailed, descriptive answers.
- Focus groups: gather diverse perspectives on a specific topic through small group discussions.
- Unstructured observations: observe behaviors and interactions in their natural setting.
- Case studies: conduct in-depth examinations of individual or group experiences.
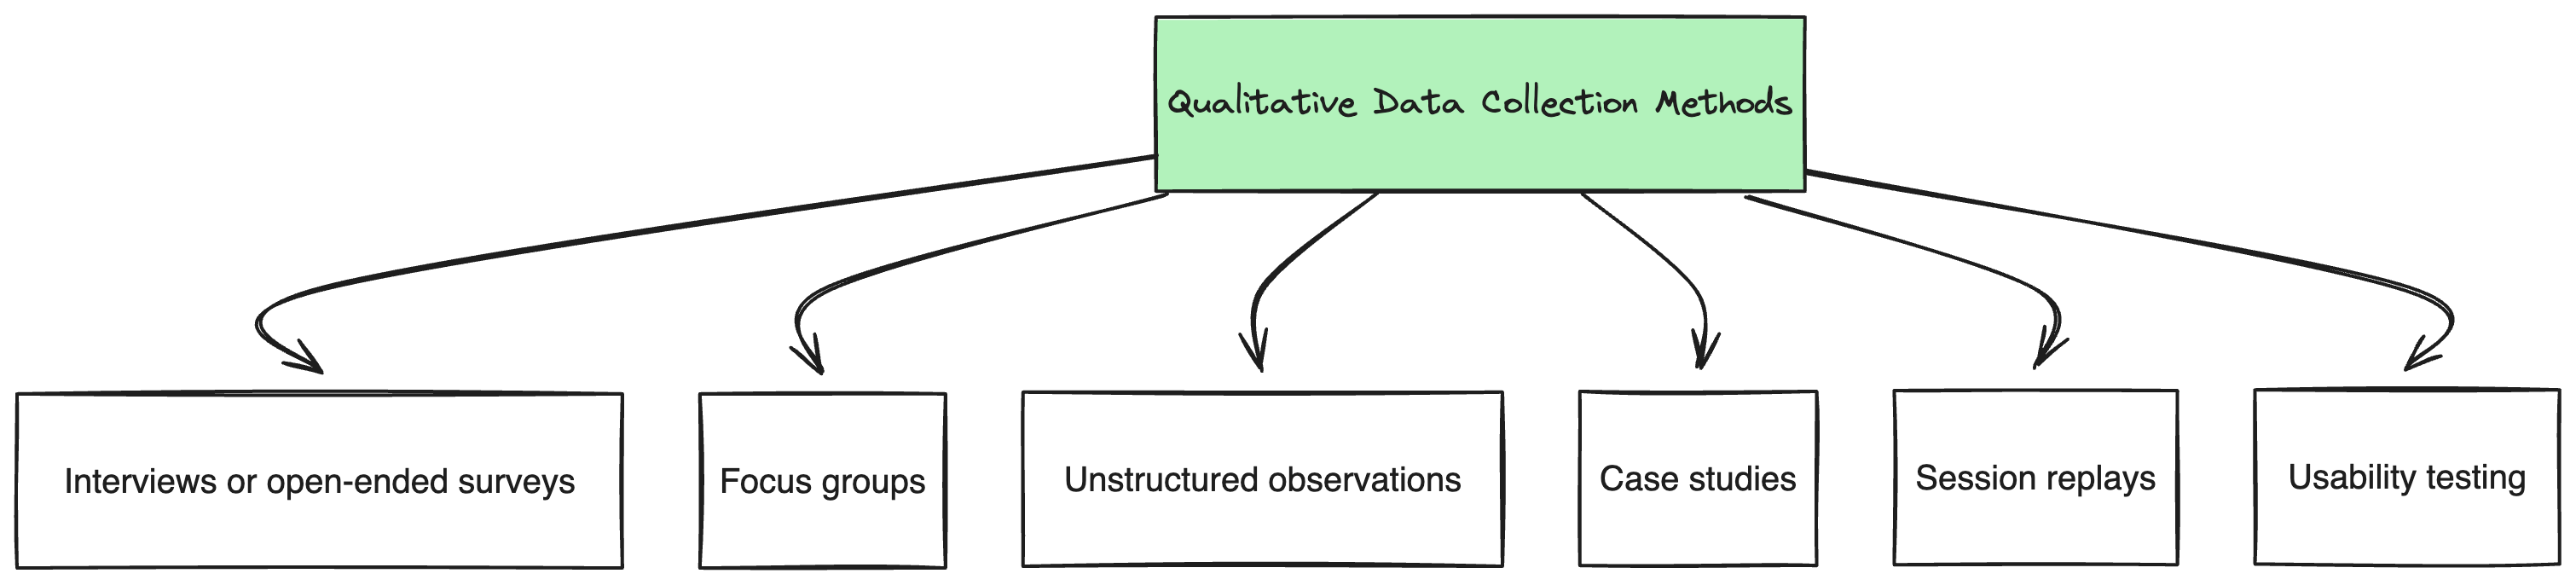 Illustration by OpenReplay team
We collect quantitative data through the following methods:
- Experiments: manipulate one or more variables to observe the effect on another variable.
- Surveys with closed-ended questions: use structured questionnaires to collect quantifiable data.
- Structured observations: define specific categories or behaviors and quantify the observations.
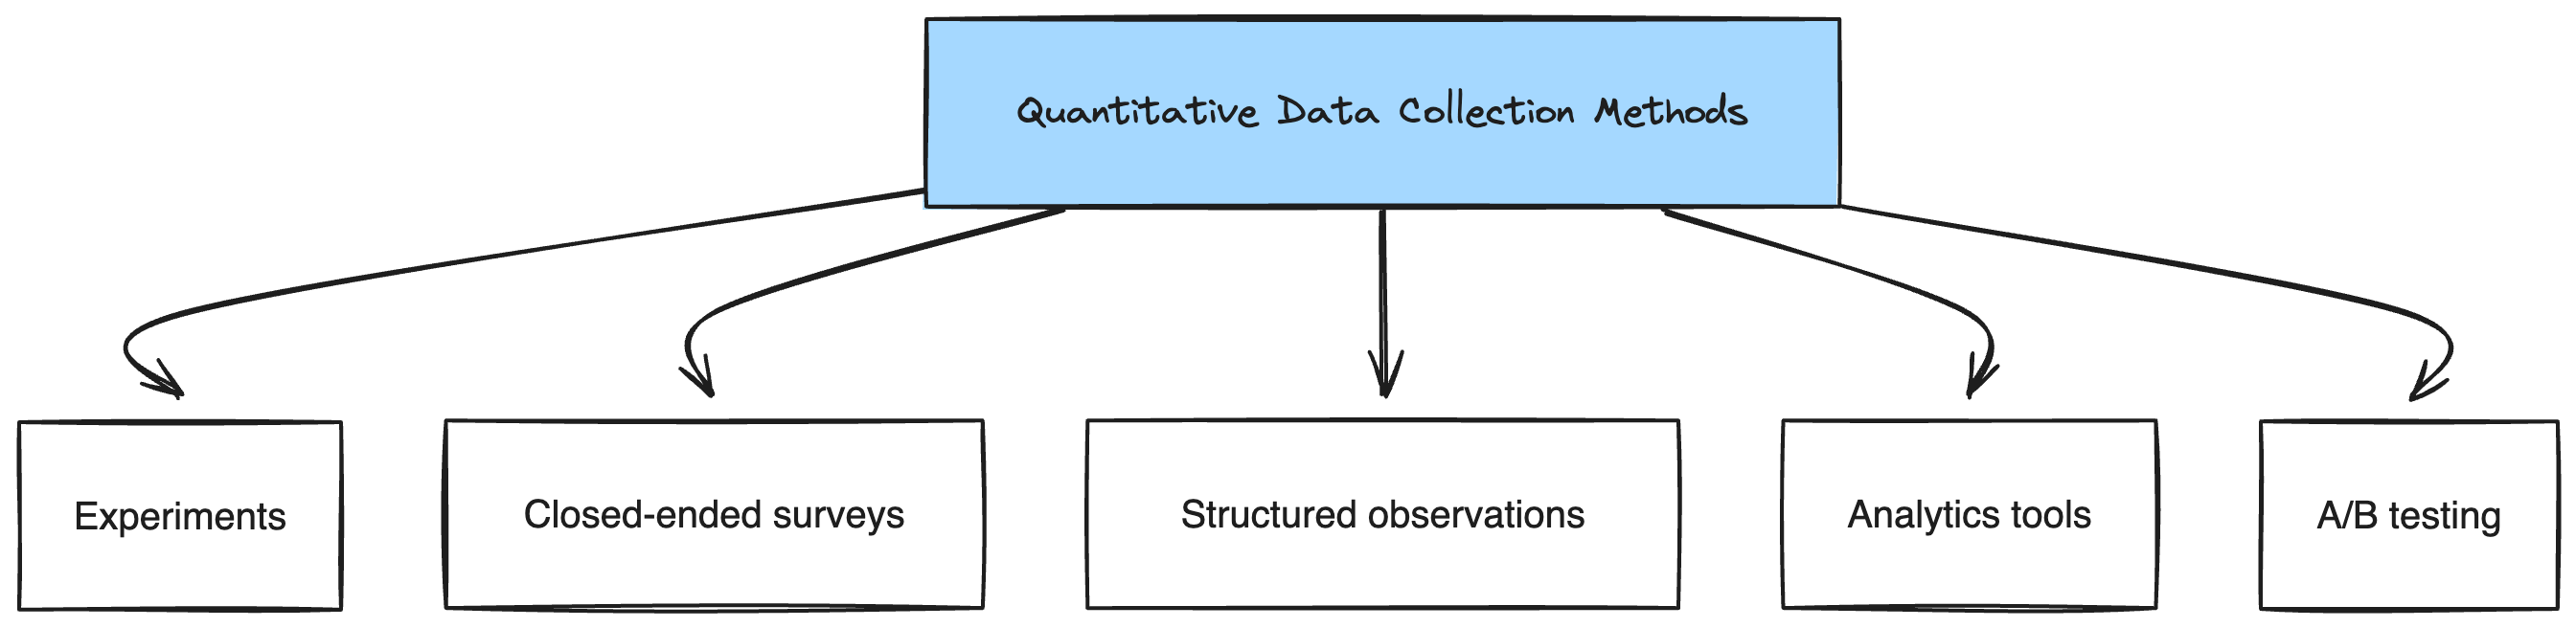 Illustration by OpenReplay team
Modern collection methods
Traditionally, qualitative and quantitative data collection methods could be done on paper. Paper surveys and written case studies were standard. However, with the rise of digital tools, data collection has been revolutionized, and so have the methods.
In the context of digital products, some qualitative and quantitative data methods are:
- Session replay (qualitative): visually recreate how users interact with a website or mobile application.
- Analytics tools (quantitative): automatically gather product and website usage data.
- A/B testing (quantitative): compare two versions of a webpage or app feature to determine which performs better.
- Usability testing (both): assess how easily users can navigate and use your product.
Choosing the “right” method
- Determine if you need to understand behaviors/experiences or measure quantities.
- Identify the data type to choose between qualitative (non-numerical) and quantitative (numerical) data collection methods.
- Assess the audience and context to select a method suitable for your target population and study environment.
- Combine multiple methods if needed to gain a complete understanding.
See the story behind the numbers
Discover how OpenReplay can help you combine session replay and analytics to get a complete view of user interactions. Understand both the numbers and the stories behind them.
Qualitative vs quantitative data: examples
Understanding qualitative and quantitative data becomes easier with specific, real-world examples. Here’s a table to show different examples:
| Example | Qualitative data | Quantitative data | Collection method |
|---|---|---|---|
| I use this feature daily because it saves me so much time compared to other apps. | | | Interviews or surveys with open-ended questions |
| Observing a user struggling to find the 'Submit' button during a test session. | | | Usability testing |
| The latest update is awesome! It fixed all the bugs I was experiencing. | | | Focus groups |
| Watching a user navigating from signup to checkout on a website. | | | Session Replay |
| 85% of 500 respondents rated their satisfaction as 9 or 10 on a scale of 1-10. | | | Surveys with closed-ended questions |
| The website had 200,000 page views and a bounce rate of 40% last month. | | | Data analytics tools |
| Product B sold 3,000 units, generating $150,000 in revenue in Q2. | | | Experiments |
| Version A had a 5% conversion rate, while Version B had a 7% conversion rate. | | | A/B testing |
Pro tip
Qualitative data can often be coded quantitatively. In other words, almost all qualitative data can be assigned meaningful numerical values.
For example, many users may be abandoning a product. Using session replay, we can find that those churning users are experiencing problems with a button that is causing dead clicks and rage clicks… These sessions can be categorized and quantified into numbers, providing a complete picture of user behavior and the issues impacting their experience.
When is qualitative data useful vs. quantitative data is useful?
Qualitative data is useful for exploring new topics, understanding behaviors, capturing emotions, generating hypotheses, and testing assumptions. Quantitative data, on the other hand, is useful for testing hypotheses, measuring variables, identifying patterns, making predictions, and generalizing results.
To ask which is “better” or more “valuable” is to ignore their intimate relationship. Depending on the context, both are useful and can complement each other. Combining the two can give a clearer picture of the situation.
In product development, especially for an early-stage product or company, you typically lack sufficient quantitative data to make informed decisions. At this stage, qualitative data is very important as it helps you understand user behaviors and experiences, which is essential for identifying and addressing early user needs and frustrations.
As your product or company stabilizes and scales, you will start to have more user interactions and can rely on quantitative data to measure variables, identify patterns, and make predictions. By integrating qualitative data with quantitative data, you can make more sense of user behavior puzzles and user experience flaws.
So, the cherry on top is when quantitative data is backed up by qualitative information, resulting in an overview that combines statistical reliability with rich, contextual understanding.
Support every stage of your product development
Use OpenReplay for qualitative and quantitative data collection for better decision-making from early development to scaling.
Qualitative vs quantitative data: benefits and limitations
Let’s break down the benefits and limitations of qualitative and quantitative data. By looking at each type separately, we can see their unique strengths and weaknesses.
Benefits of qualitative data
- Captures the human element and emotions behind behaviors and decisions.
- Offers rich context to explain patterns observed in quantitative data.
- Allows for exploration of unexpected topics that emerge during data collection.
Limitations of qualitative data
- Data is subjective and open to interpretation, which can lead to bias.
- Findings are often not generalizable to a larger population due to small, non-random samples.
- Data collection and analysis are time-intensive and resource-heavy.
- It often focuses on a limited scope or specific context, which may miss broader trends.
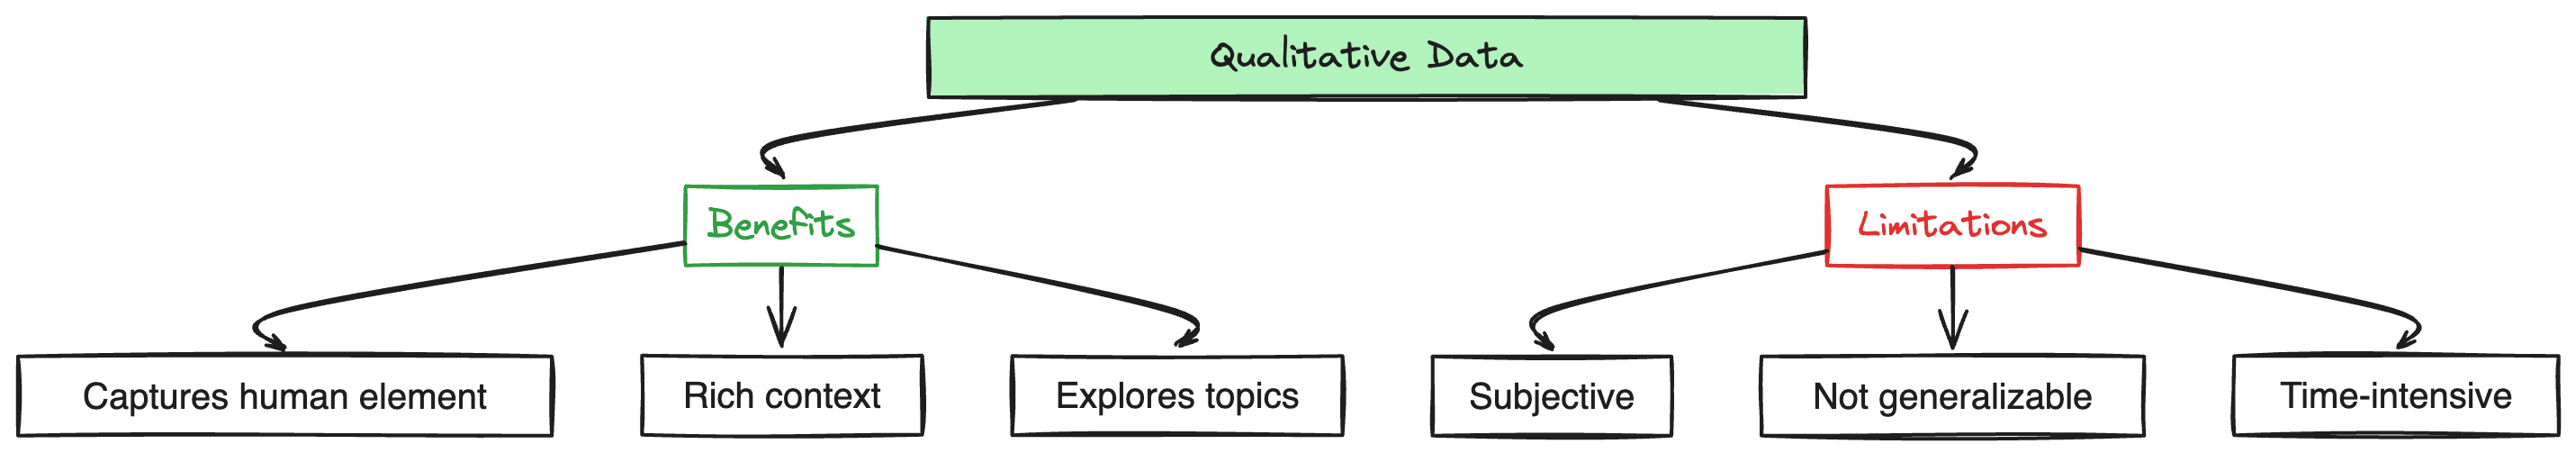 Illustration by OpenReplay team
Benefits of quantitative data
- Results can be generalized to larger populations due to large, random samples.
- Provides numerical data that is objective and easy to analyze.
- Data collection and analysis can be faster and less resource-intensive.
Limitations of quantitative data
- Provides limited insights into underlying reasons, emotions, and motivations.
- It may overlook the context behind the numbers, missing nuances and subtleties.
- Predefined response options can limit the richness of the data collected.
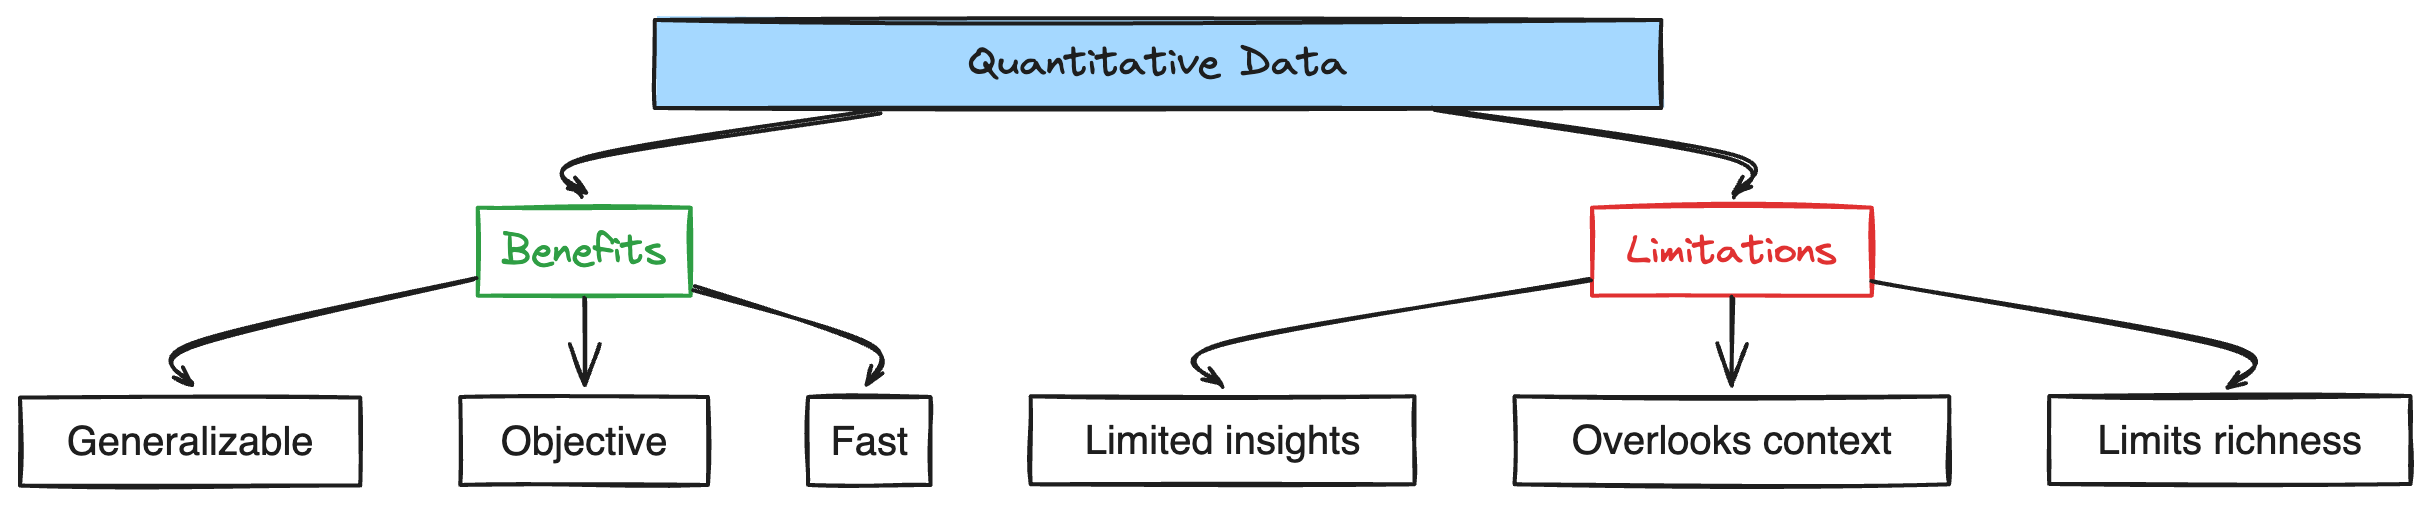 Illustration by OpenReplay team
Interestingly, when you combine qualitative and quantitative, you can often overcome many limitations and amplify the benefits.
Why choose OpenReplay for your qualitative and quantitative data collection needs?
OpenReplay gives your data a clear and convincing voice, helping you uncover the stories behind the numbers.
With OpenReplay, you can capture detailed session replays that let you see your product through your users’ eyes. Visualize user interactions, identify underlying issues, and understand the human element behind every click, error, and user path. This qualitative data, combined with quantitative metrics, provides a deep understanding of user behavior.
You can make sense of your product’s quantitative data with OpenReplay’s analytics tools. Track conversion funnels, map user journeys, and analyze heatmaps and trends. This quantitative data helps you identify friction points and ensure your improvements lead to better digital experiences.
From early development to scaling, OpenReplay supports every stage of your product lifecycle. Integrating session replays with detailed analytics allows you to validate findings, explore underlying reasons, and make data-driven decisions that enhance your product.