The definitive guide to profiling React applications

Knowing how to profile a React application to improve real-world performance is a good tool in any front-end developer’s toolkit. The Profiler API allows us to do just that with insights on why and how long our components are rendering for.
We can use the profiling data to find unnecessary and expensive renders that may be impacting performance negatively. Thankfully, it’s not that complicated. Let’s take a look at the Profiler API that comes bundled with every React install.
You can interact with the React Profiler API in two ways:
- The React Devtools extension
- The Profiler Component
Both allow you to interact with the same data, but in different ways. Whichever one you choose depends on your use case. By the end of this article, we will have covered how to use the Profiler API to measure and improve the performance of a React app.
The React Devtools extension
The Devtools profiler offers a simple, visual way of profiling a React app. We can visually see components that re-render and even pinpoint the cause of the render. Using such valuable information, we can make decisions to reduce unnecessary renders and optimize performance.

Let’s take a look at the interface of the profiler so that we’re able to understand the profiling data. I’ve numbered each section (in red) so that we can break it down bit by bit. 1. Component chart This is a chart of all the components being profiled in a commit. To understand what a commit is, we have to understand how React renders a component. It does this in two phases —
- The render phase where it determines what changes need to be made to e.g. the DOM. During this phase, React calls
renderand then compares the result to the previous render. - The commit phase is when React applies any changes. (In the case of React DOM, this is when React inserts, updates, and removes DOM nodes)
So a commit is basically all the changes applied from the render phase. A render may not always lead to a commit (i.e there are no new changes) but a commit is always from a render so you can think of a commit as a render even though they don’t exactly mean the same thing.
The component chart can display different types of information depending on the currently selected view. It can display either —
- A tree of all components being rendered in the commit
- A sorted view of all the components in order of slowest to fastest
In this view, we can also hover over the component bars to see information like if and why the component rendered, the duration of the render (or commit), and based on colour of the bar, whether it’s a relatively slow or fast render.
2. Tabs
-
Flamegraph tab — shows the component tree for the current commit. It Includes render information about each component in the tree. The length and colour of the bars indicates how long the render took.

- The longer a bar is relative to the other bars, the more time it took to render
- The yellower a bar is, the more time it took to render
- The bluer a bar is, the less time it took to render
- If the bar is grey, it didn’t render
You can also hover or click on a component bar to get information on why the component rendered (you have to enable this in the profiler settings using the gear icon before profiling)
-
Ranked tab — Similar to Flamegraph but sorts the components based on which took the longest time to render. The slowest components will be at the top and the fastest will be at the bottom. This makes it easy to identify which components are affecting performance the most.

-
Interactions tab — Shows information on how long certain UI actions take using the experimental tracing API. It can track actions like whether a specific button was clicked or whether a form was submitted. Because it is still experimental and the API is prone to change at any time, we will not be focusing on it.
3. Commits overview This shows an overview of all the commits (renders that led to actual DOM updates) being made as the app renders. The slower a commit is (i.e the slower the render), the longer the bar will be. We can navigate back and forth between commits to get more information about a particular commit.

This is useful in instantly identifying when an app is making more commits than expected. For instance, if you type a single word in an input and there are 20 commits being made for just that action, then there’s a good chance some of those commits are unnecessary.
4. Commit information This shows information about a specific commit. You can gain useful insight like when the commit was made (Commited at), how long the commit took (Render duration), and if enabled, the interactions that triggered the commit (Interactions).
When a component is clicked from the component chart, the commit information section also shows extra details like why a component rendered and a list of all the commits recorded during profiling.
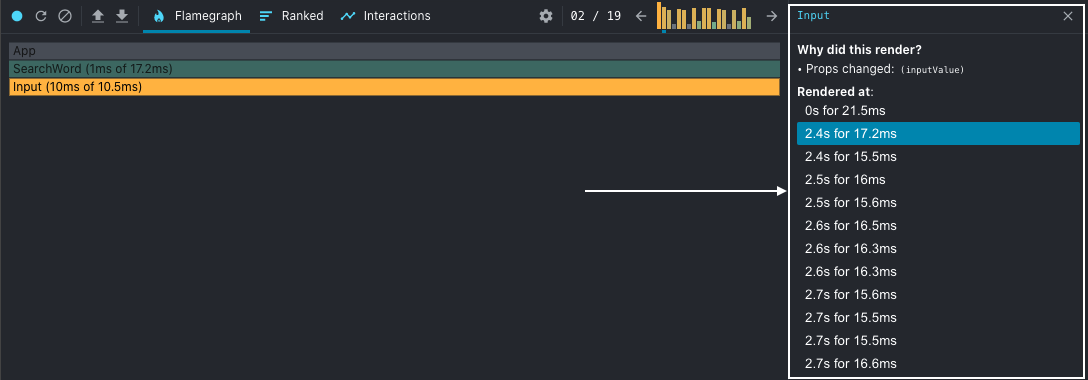
This can help us identify props, state variables, and hooks that may be causing unnecessary renders i.e a function prop being redefined in the parent component.
The Profiler Component
This is a lower-level way of interacting with the same profiling data as with the extension. Instead of a visual representation of performance using colours and bar lengths, the Profiler component provides a more textual way of profiling a React app.
It is in fact what the extension uses under the hood to display the performance data in a visual way. This means that it is more flexible to use as you can choose to do whatever you want with the data. For example, you could render it as a graph or store it in a database so you could track performance changes over the lifetime of your app.
How to use the Profiler component In the simplest of terms, it wraps over a React component and measures how often the component renders and how long the renders take. To use it, you wrap the component you want to measure in the Profiler component —
<Profiler id="definition" onRender={callbackToProcessRenderInfo}>
  <Definition />
</Profiler>
It takes in two props —
id- A unique identifier for the component you’re profiling. This is useful for differentiating between different components if you’re profiling more than one at the same time or just for identification purposes.onRender- A callback function that receives the profiling data as arguments. You can do whatever you like with this data such as logging it, graphing it, etc. It receives the following arguments —id- An id string prop passed to the Profiler componentphase- Can be either “mount” or “update” and tells you if the component is mounting for the first time or whether it’s updating due to a props, state, or hooks change (i.e re-rendering)actualDuration- The time spent in milliseconds rendering the Profiler component (The Profiler adds a tiny performance overhead) and all its descendantsbaseDuration- The estimated time in milliseconds that would be spent rendering the descendants without any memoisations. The delta between this andactualDurationshould tell you how useful yourReact.memoanduseMemocallls are (for more information about these calls, you can read this article on memoisation in React.startTime- A timestamp of when React began rendering the current updatecommitTime- A timestamp of when React committed the current updateinteractions- A Set of interactions (if any) that were being traced when the update was scheduled
A simple onRender callback would look something like this —
function callbackToProcessRenderInfo(id, phase, actualDuration, baseDuration, startTime, commitTime) {
  // we can log it to a database or render it out as a chart
  logToDatabase({ id, phase, actualDuration, baseDuration, startTime, commitTime })
}
In this case, the callback function is simply logging the performance data to a database where we could do more things like rendering it in a chart similar to what the devtools extension does.
Profiling a React app
Let’s profile a simple dictionary app using the Devtools extension to see how to improve the performance.
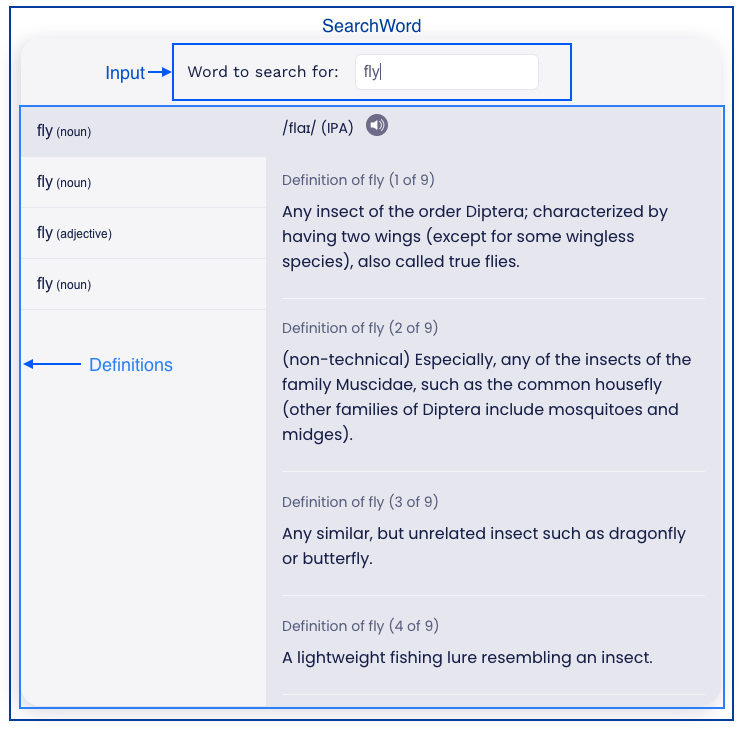
This is a very simple app consisting of three components —
- SearchWord - This is the main wrapper component. It has the following state variables —
formInput→ This is the word we want definitions for. Also used in theInputcomponententries→ Used to store the definitions forformInput. Also used in theDefintionscomponent
- Input - Used for capturing user input. It receives its value (
formInput) andonChangehandler from the parentSearchWordcomponent. - Definitions - Used to display the definition entries and the current selected entry. Receives the definition entries (
entries) from it’s parentSearchWordcomponent.
When a user types into the input field, we set the value into formInput. We have a useEffect that runs when formInput changes to fetch the definitions for its current value which we store in entries and pass on to the Definitions component as a prop.
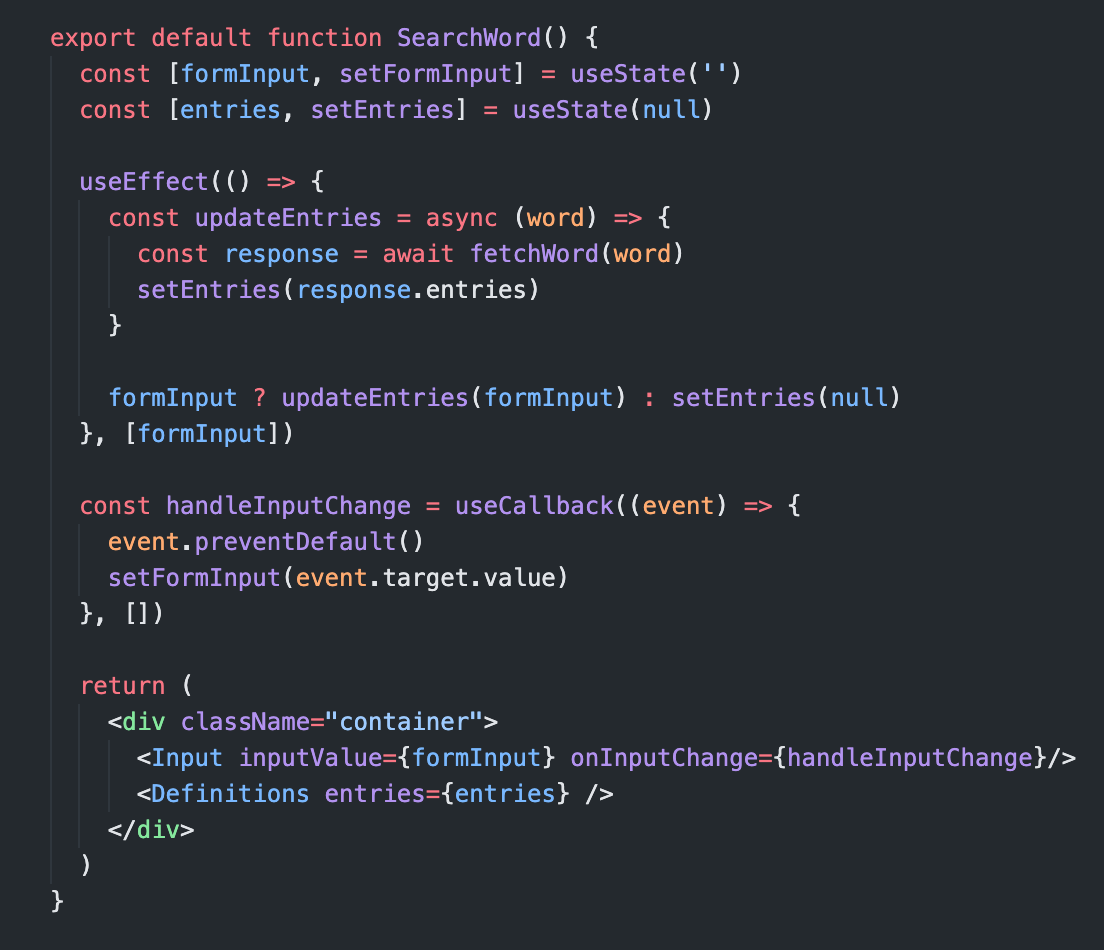
This is very barebones without any error handling but it’s good enough for the purposes of showing how the devtools profiler works. To get started —
Profiling and optimizations
- We’ll install the React devtools Chrome extension
- Start a profiling session
- Search for the word “flame” by typing into the input field
- End the profiling session and view the data
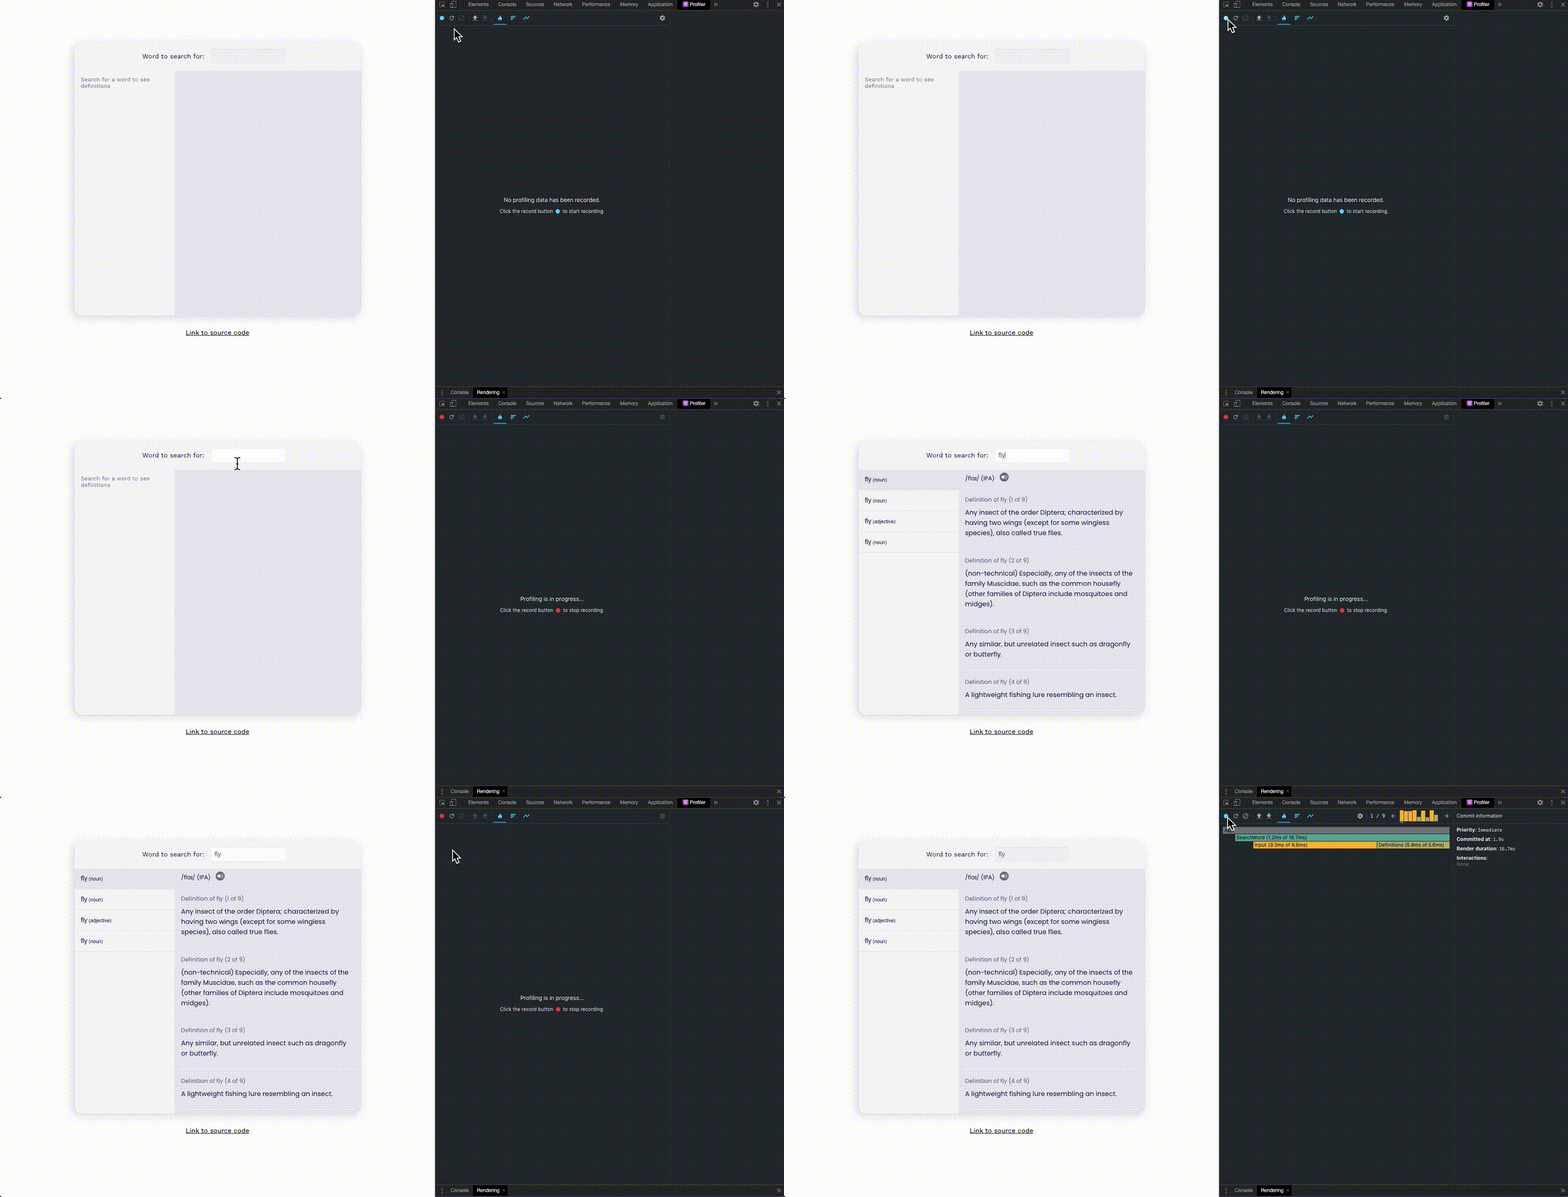
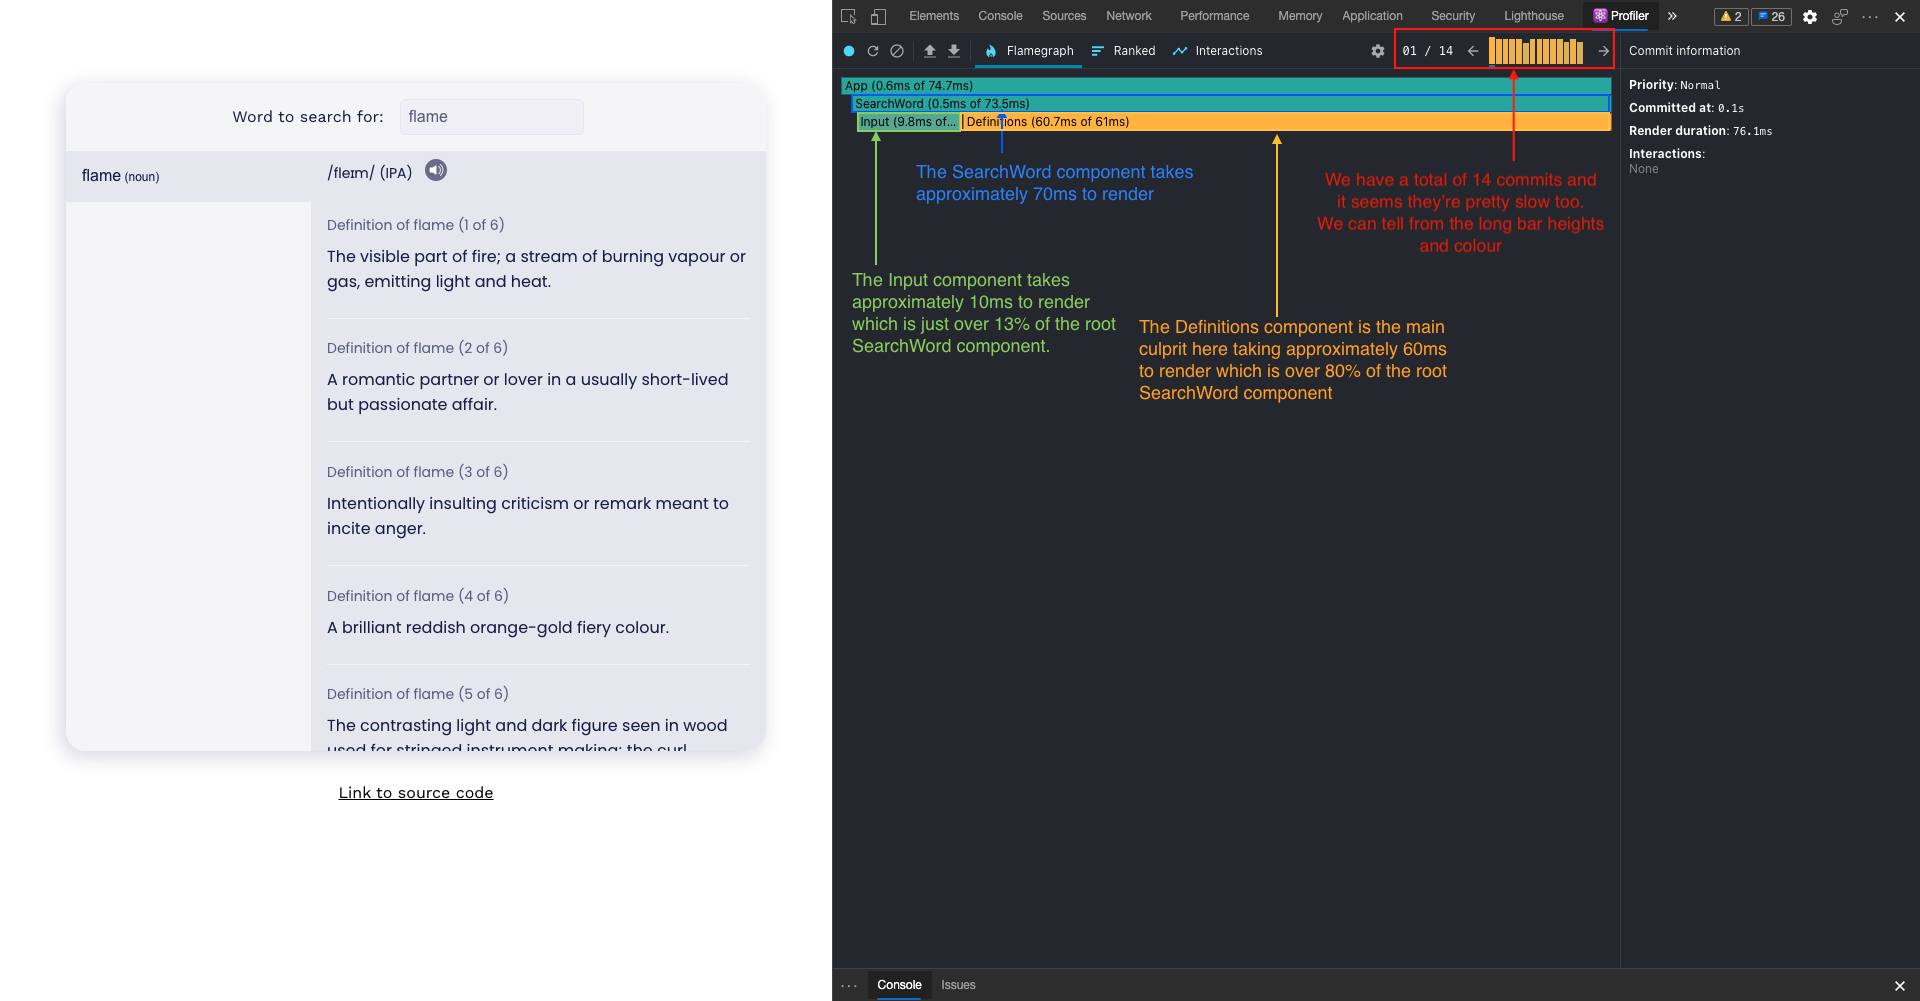
This is the result of the first render and the results are certainly interesting.
-
We have a total of 14 commits, and it seems they’re pretty slow too. We can tell from the commit bar height and colour.
-
The root SearchWord component is taking 73.5ms to render on mount. This isn’t bad enough to cause noticeable problems but it is taking up valuable CPU resources that could be shared by other programs on the computer.
-
The Input component contributes around 13% to the render duration at around 10ms of render time. This sounds about right and doesn’t seem like it would benefit from some performance optimisations.
-
The Definitions component on the other hand is a bit alarming. It renders for around 60ms which contributes over 80% of render time. Looking at other commits using the commit overview, we can see it is also the main cause for the slow commit times on re-renders.
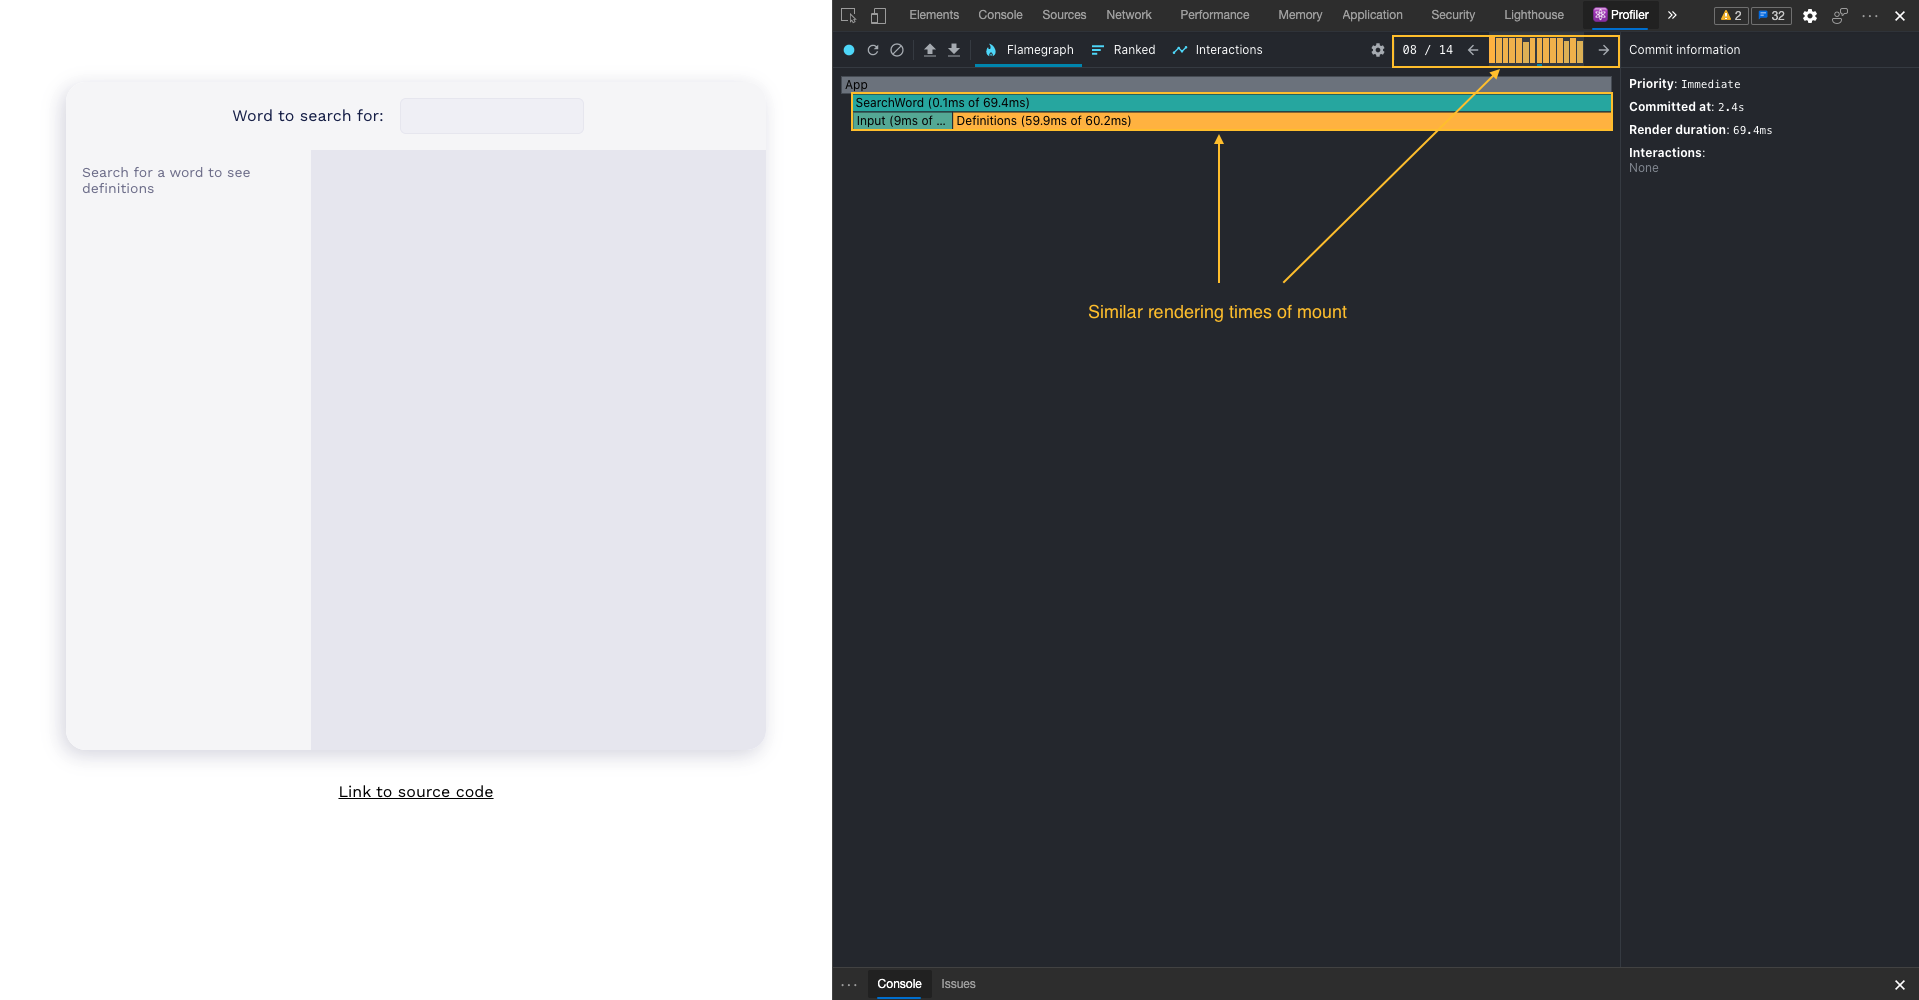
We can pick a commit in the middle of the history where the app is updating and we seee that the rendering times are similar to the mount render times.
Compiling the results along with data from the “Networks” tab in the Chrome inspector tools, we get the following results for a search of the word “Flame” —
- 14 commits
- All commits updated Definitions (It’s re-rendering too much)
- 5 network calls (But we only want definitions for one word)
- 1127ms total SearchWords render time
- 1029s total Definitions render time
How would we improve the performance in this case?
A first step would be to take a look at why the Definitions component is re-rendering on every commit. The answer lies in the logic of the app. We’re making a new search every time the user types a letter. This is making a network request and updating the definition entries on each keystroke triggering re-renders.
Ideally, we want the search to kick off only when the user stops typing and only then updating the definition entries.
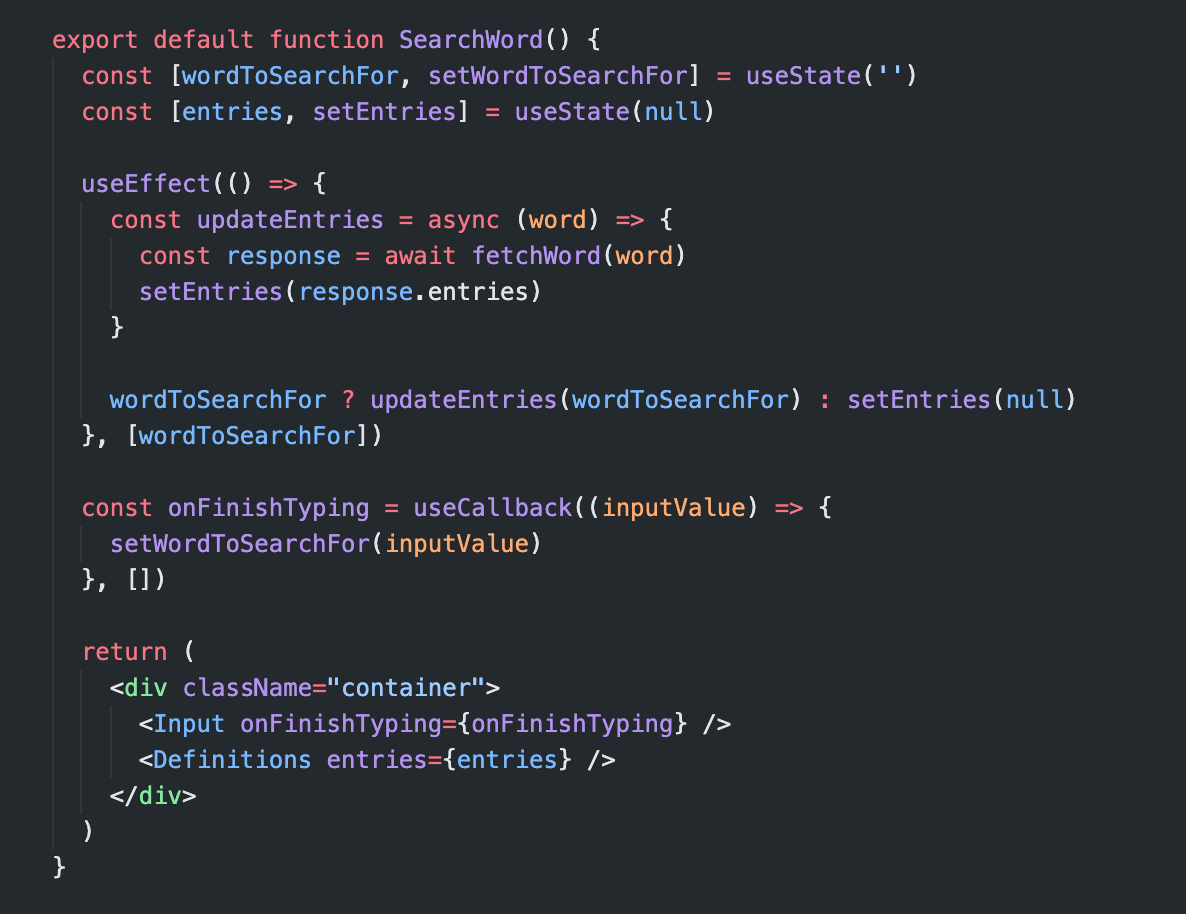
The fix is to make the Input control it’s own state and only make a request when the user is finished typing. This would make the Definitions component render far fewer times as it would only update when we make the request at the end of the typing session.
The SearchWord component would also re-render fewer times as it will no longer re-render on the input change event.
Finally, instead of 5 network calls for the word “flame”, we’d only make 1. Let’s see if this improves the rendering times. I’ll commit the change, refresh the app, start another profiling session, and search for the word “flame”.
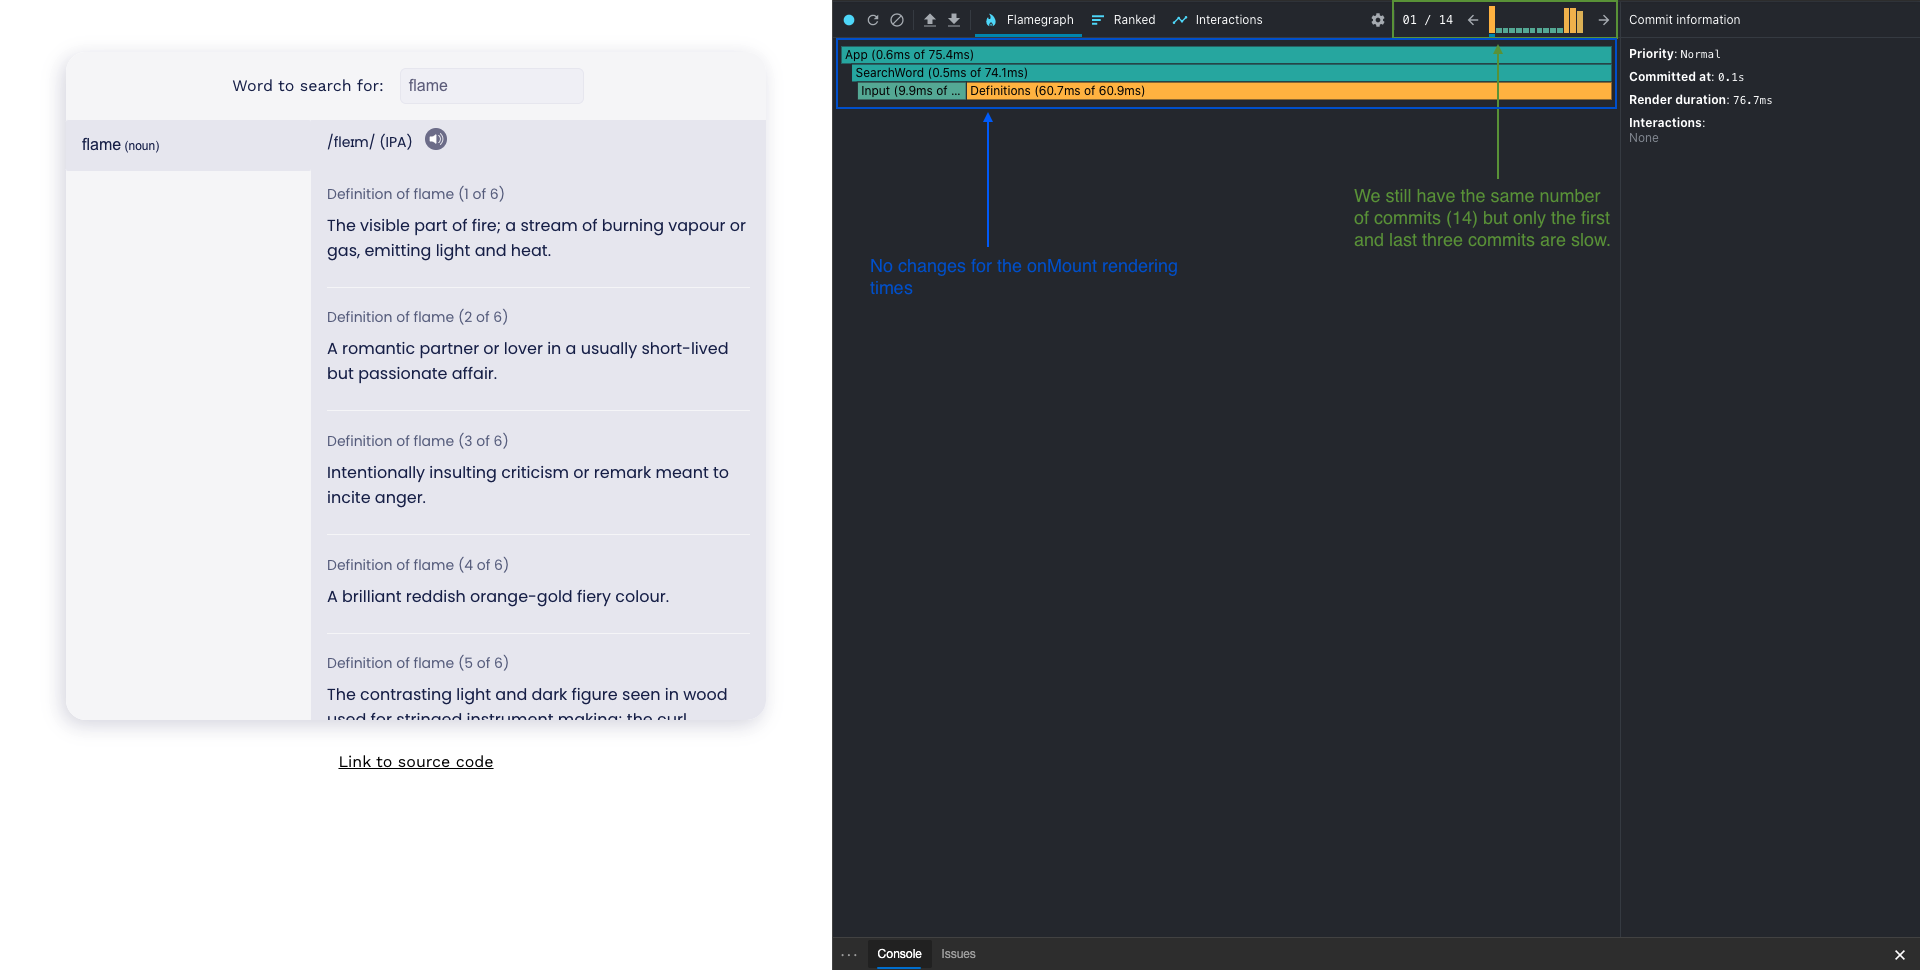
Immediately, we can see improvements in our rendering times. The rendering times for the first mount didn’t change much. The commits overview, however, is where we see the improvements.
Previously, the Definitions component rendered every time the Input component rendered. Because it is a slow component, it used up a lot of time and resources on every keystroke. Now, however, we’ve reduced the number of times it has to re-render and the app becomes more efficient.
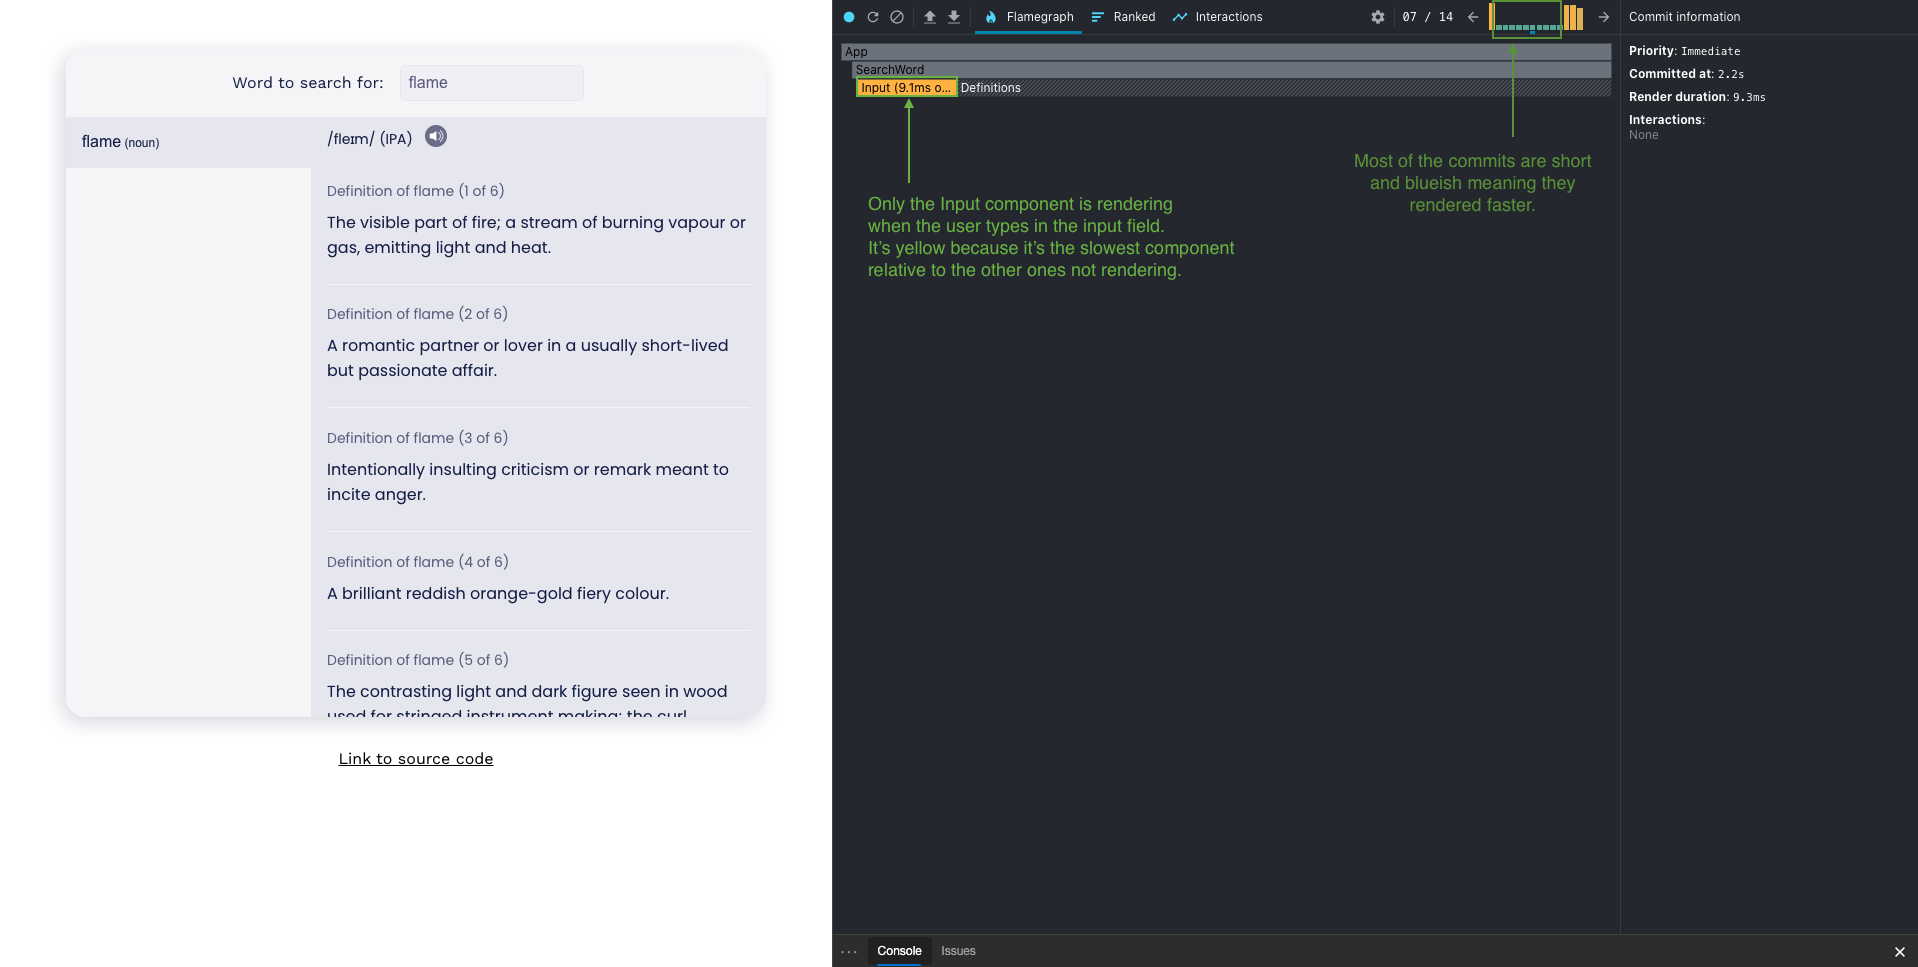
Subsequent updates where only the Input component re-renders are fast and complete in around 10ms. Since the definition entries are not updated until the user stops typing, the Definitions component does not re-render.
Also, because the Input component now manages it’s own state, typing in the input field doesn’t re-render the parent SearchWord component. Only the Input component re-renders on the onChange event.
The profiling data for the session now looks like this
- 14 commits
- Only first and last 3 commits updated Definitions (We’ve reduced the number of renders)
- 1 network call (We only make a call for the exact word we want)
- 296.4ms total SearchWords render time
- 273.3ms total Definitions render time
This is some amazing improvements in just one change. We can take it further if we want like optimizing the Definitions component to reduce rendering time. However, you could argue that it is pointless chasing after milliseconds of improvement at this point. I say it’s fun and can be useful 🙂
Measuring front-end performance
Monitoring the performance of a web application in production may be challenging and time-consuming. OpenReplay is an open-source session replay stack for developers. It helps you replay everything your users do and shows how your app behaves for every issue. It’s like having your browser’s inspector open while looking over your user’s shoulder.
OpenReplay lets you reproduce issues, aggregate JS errors and monitor your React app’s performance. OpenReplay offers plugins for capturing the state of your Redux store and for inspecting Fetch requests and GraphQL queries.

Happy debugging, for modern frontend teams - Start monitoring your web app for free.
Next steps
Once you know how to identify bottlenecks in your React application using the Profiler API, you can explore other ways, especially if performance is important to your business.
Additional ways to measure performance in JavaScript apps —
After profiling and analyzing bottlenecks in your app, you can then look into ways of improving performance using techniques like memoisation and lazy loading.
Here’s an article on implementing memoisation in React using React.memo and useMemo and one on lazy loading in React apps.
If you’re interested in general improvement tips for the web, here’s an article on 10 of some of the weirdest web performance tips.
Link to source code for the application profiled in this tutorial. Check out more of my articles on React and JavaScript on my blog.
