How to use Chrome as a Code Editor and Debugger
Few developers delve too deeply into browser “DevTools”. There’s a daunting range of complex-looking features, but it’s reached a point where you could use Chrome as your complete development environment. You’re unlikely to abandon VS Code or Sublime Text, but using a browser may be an option if you’re on someone else’s PC or need to edit a line or two.
The following sections describe how to use Chrome’s editing and debugging facilities. Chromium, Edge, Opera, Vivaldi, and Brave use the same engine and have the same tools. Depending on your browser and OS, you can open DevTools from the menu: press F12, or Ctrl|Cmd + Shift + i. Safari and Firefox have different sets of features, and they may not offer the same editing functions, but they also have their own tricks to aid development; for example, Firefox indicates which DOM elements have event handlers attached.
Quick Edits on Any Site
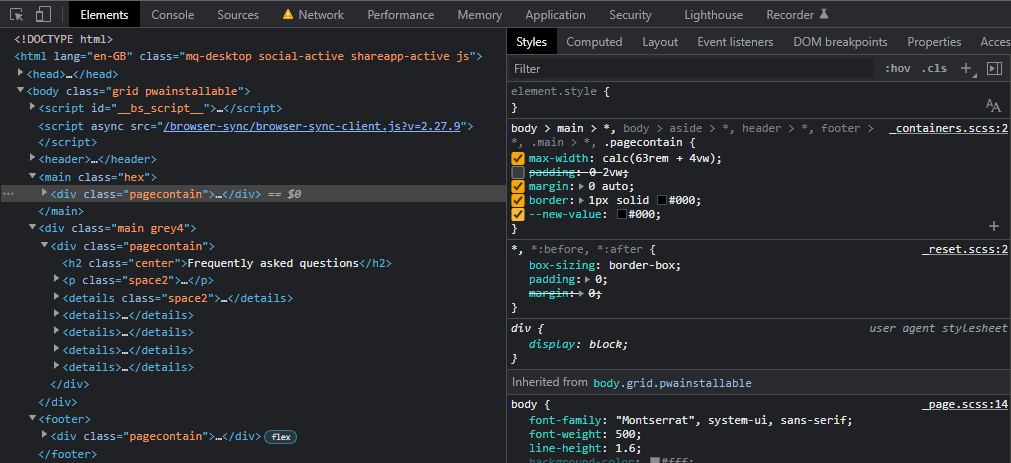
When viewing a page either on a local development or live site, the Elements panel allows you to inspect, disable, enable, add, edit, or remove any CSS selectors and properties:
The Sources panel allows you to edit any CSS or JavaScript file by locating it in the Page pane.
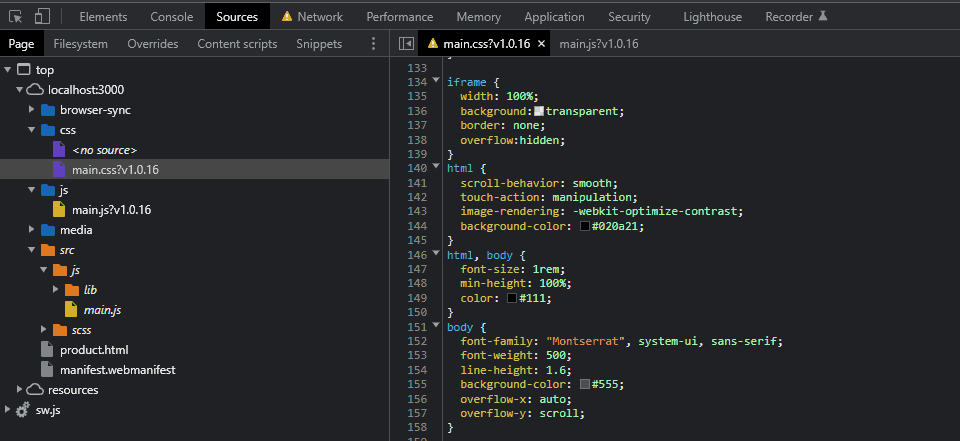
Press Ctrl | Cmd + S to save a file but be aware that it’s saved to memory. The yellow warning icon indicates that changes are not permanent.
If your code defines source maps, you can open the “files” (see the src folder above) but changes will not apply to the active page. However, you can prettify minified code in the generated files by clicking the {} icon and then editing.
You will lose all your updates as soon as you navigate away or refresh the page. Fortunately, the Changes panel identifies your current updates. It’s available from the 3-dot menu in the drawer panel or More tools in the main menu:
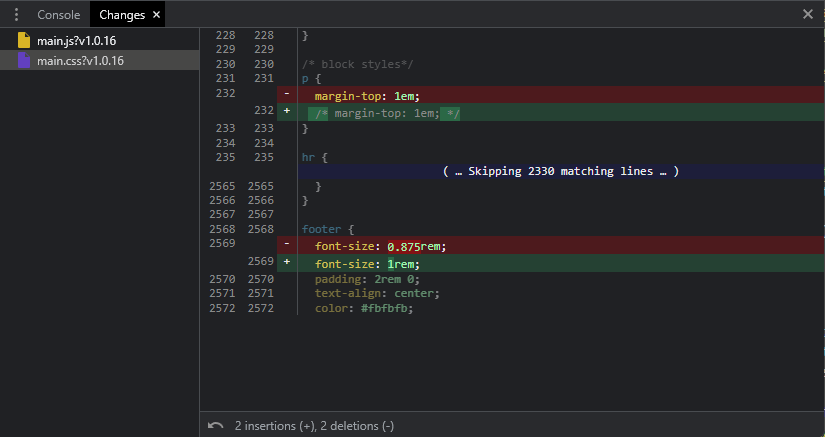
It’s impossible to save code from the Changes panel, but it allows you to locate all your updated files. Right-click any file in the folder pane, and you can choose Save As to download a local copy and import it into your project.
Override Files on Any Site
You can override any file on a local development or live site. To start, select the Overrides pane in the Source panel and click + Select folder for overrides:
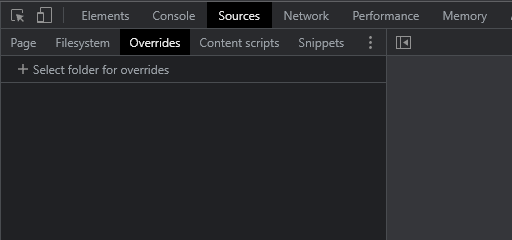
Select a directory on your system, then click Allow so Chrome can write to it.
Return to the Pages panel, then right-click any file and choose Save for overrides:
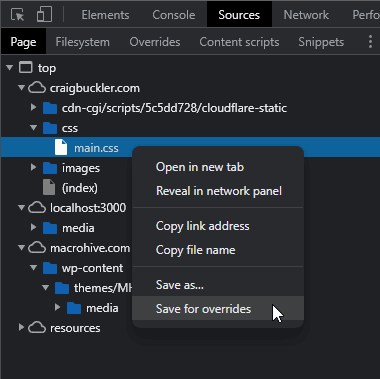
This saves the file to your overrides folder. A purple circle overlay indicates that the file is on the local system:
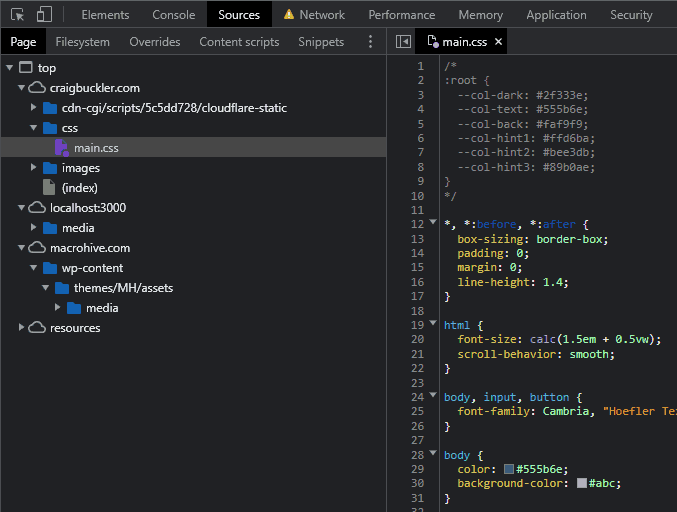
You can hit {} to prettify minified code and make any changes you require. Updates render immediately, and because the file is saved locally, the changes are reapplied across all pages in the domain whenever DevTools is open (it doesn’t affect the site for anyone but you).
The Changes panel still shows differences, but you can also copy the edited file into your source. Remember you are editing the final built file, and changes may need to be applied to the source files used during any build process.
Editing Development Source Files
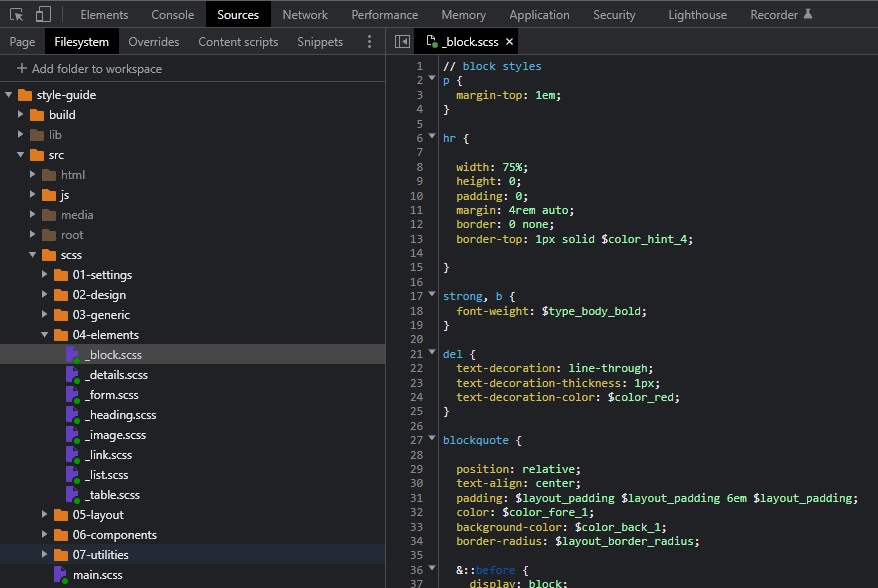
You can use Chrome as a standard text editor on local source files regardless of any build system you’re using. It offers most editing basics such as line numbering, undo/redo, color coding, and auto-completion. To start, select the Filesystem pane in the Sources panel and click + Add folder to workspace:
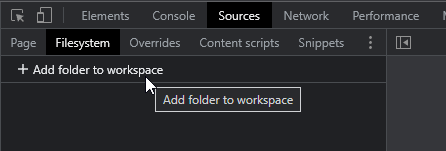
Choose a project location, then click Allow so Chrome has permission to read and write to that folder. You can now open and edit any file as you would in an editor:
Debugging with Console Messages
Some developers claim you should never use console.log(): you’re changing source code, and there are better debugging options. This is true … but I don’t believe anyone who says they never use it! The console object provides a range of methods, including:
console method | Description |
|---|---|
.log(msg) | output a message to the console |
.log('%j', obj) | output an object as a compact JSON string |
.dir(obj,opt) | pretty-print objects and properties |
.table(obj) | outputs arrays and objects in tabular format |
.error(msg) | output an error message |
.count(label) | a named counter which reports the number of times the line executes |
.countReset[label] | resets a named counter |
.group(label) | indents a group of log messages |
.groupEnd(label) | ends the indented group |
.time(label) | starts a timer to calculate the duration of an operation |
.timeLog(label) | reports the elapsed time since the timer started |
.timeEnd(label) | stops the timer and reports the total duration |
.trace() | outputs a stack trace (a list of all calling functions) |
.clear() | clear the console |
console.log() also accepts a list of comma-separated values. For example:
let x = 321;
console.log('x:', x);
// x: 321
ES6 destructuring offers similar output with a little less typing:
console.log({ x });
// { x: 321 }
console.dir() can output complex objects to any property depth with or without color coding:
console.dir(obj, { depth: null, color: true });Debugging Client-Side Apps
You can open a JavaScript file from the Sources panel and click any line number to set a breakpoint (denoted by a blue marker). Note you can also select files and add breakpoints in source maps which may be easier.
A breakpoint specifies a point where the debugger will pause processing so you can inspect the state of the program and progress to the following line. You can define any number of breakpoints, but you should only need to set them where you want to start debugging.
Run your code — perhaps by refreshing the page or activating an event handler — and the code will halt at the breakpoint location:
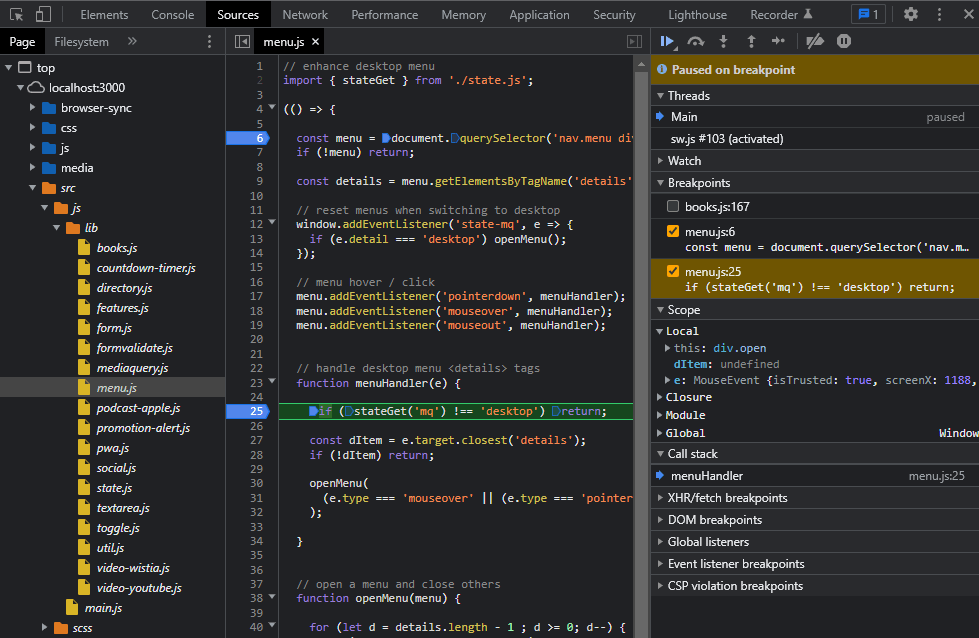
The right-hand panels include:
-
a Watch pane, where you can monitor specific variables by clicking the + icon and entering their name
-
a Breakpoints pane with all breakpoints and allows you to enable or disable any
-
a Scope pane displays the state of all local and global variables, and
-
a Call Stack pane lists the functions called to reach this point in the code.
A row of icons appears above the Paused on breakpoint message:
![]()
From left to right, the icons perform the following actions:
-
resume execution: continue processing until the next breakpoint or code termination
-
step over: execute the next command but remain within the current function — do not jump into any function it calls
-
step into: execute the next command and jump into any function it calls
-
step out: continue processing to the end of the function and return to the calling statement
-
step: similar to step into, except it won’t jump into an
asyncfunction -
deactivate all breakpoints — useful if you want to temporarily run code without interruptions but don’t want to lose your breakpoints
-
pause on exceptions: halt processing when an error is raised.
DevTools offers several more debugging options. As well as manually defining breakpoints, you can add a debugger statement to your code. This activates the debugger when DevTools is open, so you should remove it from production code.
Conditional breakpoints check a value before halting execution. Imagine you have a loop running from 0 to 999 and need to see the state at the last iteration. Rather than adding a standard breakpoint and clicking resume 999 times, you can right-click a line, choose Add conditional breakpoint, then enter an expression such as loopValue === 999.
Log points are in effect console.log() without code! Right-click any line, choose Add log point, then add the expression:

DOM breakpoints activate whenever JavaScript code changes a DOM node or its children. Activate them from the Elements panel by right-clicking any node, clicking Break on, and choosing an appropriate option.
Ajax breakpoints activate whenever JavaScript makes a Fetch() or XMLHttpRequest call to retrieve data from a URL. From the Sources panel, open the XHR/fetch breakpoints pane on the right, click + and enter a full or partial address to enable the breakpoint.
Finally, you sometimes want to ignore code you’re using but cannot change, e.g., jQuery, frameworks such as React, third-party JavaScript such as analytics, etc. Press F1 or click the cog icon to open Settings, choose the Ignore list tab, and add any number of full or partial URL/file names. From that point, the debugger will skip code in those files and ignore any exceptions they throw.
Open Source Session Replay
OpenReplay is an open-source, session replay suite that lets you see what users do on your web app, helping you troubleshoot issues faster. OpenReplay is self-hosted for full control over your data.
Start enjoying your debugging experience - start using OpenReplay for free.
Debugging Node.js and Deno Apps
You can also debug Node.js and Deno server-side applications directly in Chrome DevTools because the runtimes use the same V8 JavaScript engine. To start the V8 inspector, launch your application with the --inspect flag. For example, to start a Node application from its index.js file:
sh node --inspect index.jsdeno and nodemon support an identical --inspect option. You can also use --inspect-brk to halt processing on the first line so you can step through the application as it starts.
The command starts the debugger listening on localhost:9229 that any local debugging client can attach to (including Chrome):
Debugger listening on ws://127.0.0.1:9229/301372bc-780a-2051-ceb2-c8d78227092eIf you’re running the application on another device or inside a Docker container, ensure port 9229 is accessible and specify 0.0.0.0 to permit access from anywhere on the local network:
node --inspect=0.0.0.0:9229 index.jsOnce your application is running, open Chrome and enter the address chrome://inspect to view all available applications:
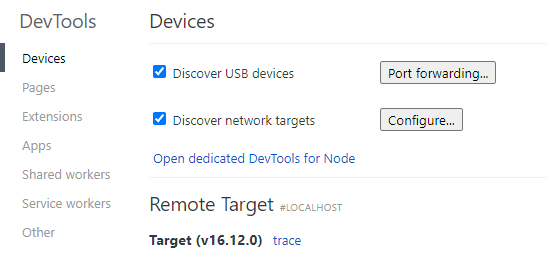
It can take a few seconds for applications to appear in the Remote Target list. If yours doesn’t, ensure Discover network targets is checked, and click Configure to add the IP address and port of the device where your application is running.
Click the target application’s inspect link to launch another DevTools window. This has fewer options than browser DevTools, and you’ll mainly want to use the Sources panel to add breakpoints. Like before, you can select the Filesystem pane and click + Add folder to workspace to edit your server-side code.
Conclusion
DevTools have evolved considerably over the past decade and have reached a point where they could become the only web development tool you need. We’ve touched on code editing and debugging facilities, but here are a few of my other favorites:
-
From the Network tab, right-click any Fetch/XHR request then choose a Copy option. You can generate valid code for JavaScript, Node.js, cURL, etc.
-
Open any image from the Sources tab, then right-click it to copy a base64 data URL.
-
Create code snippets in the Sources Snippets panel so you can run the same JavaScript on any page.
-
Halt infinite loops by pressing the pause/resume icon to stop execution, then holding down the same icon and choosing stop.
-
Debug a site running on an Android phone connected to your PC via USB from the
chrome://inspectpanel. You can also define port forwarding, so any local or remote site appears aslocalhost:<port>on the device. -
The Rendering panel provides facilities for assessing Core Web Vitals, emulating
prefers-color-scheme, print-friendly stylesheets, reduced motion, and more. -
The Issues panel offers suggestions and advice when using an API that will change in future Chrome releases.
More DevTools tips:

